
Climate Change Is Accelerating
A Source-Audited White Paper on Faster Rates, Intensifying Extremes, and Expanding Consequences
Version 1.2 (Claude + independent red-team corrected) | Evidence cutoff: August 23, 2026
Organized with the Job One for Humanity climate-system and consequence framework. Scientific claims are independently sourced.
Quick navigation
Executive Summary | Methods | Falsification Test | Heat-Loading Engine | Oceans and Coasts | Ice, Snow, and Albedo | Water Cycle | Storms and Circulation | Wildfire and Dust | Carbon and Ecosystems | Human Consequences | Exponential Question | Limits | Conclusion | FAQ | Glossary | Evidence Matrix | Bibliography
Executive Summary
Climate change is no longer best described as a slow, uniform rise in global average temperature. The evidence now shows a broader and more dangerous pattern: several core indicators are increasing at faster rates, many consequences are becoming more frequent, severe, long-lasting, or widespread, and multiple systems are interacting in ways that can turn gradual physical change into abrupt human disruption. [S03, S07, S38]
The scientific evidence comes primarily from peer-reviewed research and major observing institutions such as the World Meteorological Organization, NOAA, NASA, the IPCC, and the Lancet Countdown. This paper also reviewed forty-one indicators organized around the climate-system and consequence categories used by Job One for Humanity. Job One provides the map. That distinction matters because an organizing framework is not itself evidence authority. [S01, S02]
Bottom line
The strongest conclusion is not that every climate variable is exponential. It is that multiple fundamental components of the climate system are now changing at faster rates, while many consequences are becoming more frequent, severe, prolonged, or geographically extensive. Some show demonstrated temporal acceleration, others show significantly higher recent rates or nonlinear responses, and still others remain uncertain or strongly influenced by non-climate factors.
Among the clearest demonstrated or strongly supported rate-change signals are Earth energy imbalance, sea-level rise, ocean heat uptake, atmospheric carbon dioxide growth, marine heatwaves, glacier and ice-sheet loss, and threshold-driven high-tide flooding. The recent global warming rate is clearly high, but the strongest statistical acceleration estimate depends on adjustment for short-term variability and is therefore classified as A2 rather than A1 in this version. Nearshore tropical-cyclone intensification and several other indicators show significantly higher recent rates or strong worsening, but are described separately from strict temporal acceleration.
Other indicators, including hydroclimate whiplash, drought, dust storms, wildfire, groundwater, atmospheric circulation, ecosystem change, health losses, and insured losses, show serious worsening but require nonlinear, regional, methodological, or multi-driver qualifications.
Three evidence tiers used in the argument
Tier 1: demonstrated acceleration or clearly higher recent rates. These are the strongest physical indicators and carry the main thesis.
Tier 2: strong worsening or nonlinear consequences. Frequency, severity, duration, scale, or threshold behavior is increasing, but a strict second-derivative acceleration claim is not always established.
Tier 3: emerging, regional, disputed, or multi-driver evidence. These findings matter, but they are not used as stand-alone proof that the global climate system is accelerating.
Thirteen findings that define the acceleration case
- Carbon dioxide is not merely higher. Its average annual growth rate rose from about 0.8 ppm per year in the 1960s to about 2.4 ppm per year in 2011-2020, while the 2025 global annual mean reached 425.62 ppm. [S04, S05]
- Human-induced warming reached a record-high assessed rate of about 0.27 degrees C per decade over 2016-2025. A separate adjusted analysis found recent rates of about 0.34-0.42 degrees C per decade across five datasets. [S07, S08]
- Earth energy imbalance, the surplus heat retained by the planet, has more than doubled in recent decades. The recent observed rate of increase is much higher than the long-record rate. [S03, S07]
- The upper ocean accumulated heat at roughly 11.0-12.2 zettajoules per year in 2005-2025, compared with about 3.05-3.91 in 1960-2005. [S03]
- Global marine heatwave days more than tripled between 1991 and 2025, and the latest decade averaged about 60 percent more marine heatwave days than the prior decade. [S07, S13]
- The satellite-era sea-level rise rate increased from about 2.65 mm per year in 1993-2011 to 4.75 mm per year in 2012-2025. [S03]
- The ocean is also losing dissolved oxygen. A 2024 model-observation comparison found the simulated global oxygen-inventory decline increasing from about 46.4 Tmol per decade in 1967-1994 to about 116.8 Tmol per decade in 2002-2018, while observation-based products showed an even stronger post-2002 decline in the upper ocean. Arctic observations found deoxygenation rates roughly six times the global mean in Atlantic-influenced waters. These results support strong worsening and model-supported acceleration, but sparse observations prevent treating the global rate as a simple direct-observation curve. [S42, S43]
- Global glacier loss accelerated about 36 percent between the first and second halves of the 2000-2023 record. Combined Greenland and Antarctic ice-sheet loss more than tripled between the early 1990s and late 2010s. [S15, S16]
- Observed hydroclimate whiplash increased about 31-66 percent at subseasonal timescales. This is strong evidence of worsening volatility and nonlinear future response, but not by itself proof of a continuously accelerating time derivative. [S19]
- Long-duration heatwaves respond nonlinearly to warming. Each added increment of warming raises the characteristic duration more than the previous increment. [S11]
- Mean nearshore tropical-cyclone intensification increased significantly over 1979-2020 even though a robust global increase in total cyclone count has not been established. This is classified as a higher recent rate, not as proof of one smooth acceleration curve. [S24, S25]
- U.S. high-tide flooding is more than twice as frequent as in 2000, and NOAA reports that the national trend is accelerating as rising mean sea level crosses local flood thresholds. [S23]
- Human consequences are also rising: estimated annual heat-related deaths averaged about 546,000 in 2012-2021, 63.2 percent above the 1990-1999 estimate; heat-related potential labor hours lost in 2024 were 98 percent above the 1990-1999 average; and climate-defined dengue transmission potential increased 48.5 percent for Aedes albopictus and 17.0 percent for Aedes aegypti from 1951-1960 to 2015-2024. [S33, S34]
What this paper does not claim
- It does not claim that every climate indicator is accelerating everywhere.
- It does not claim that every damaging event was caused only by climate change.
- It does not claim that every rising loss curve is a pure physical-climate signal. Population, wealth, land use, ecological degradation, resource overshoot, and governance strongly shape consequences.
- It does not label a curve exponential merely because it rises quickly.
- It does not treat one new paper as a final verdict when the wider literature is mixed.
- It does not claim that AMOC collapse is imminent, that global tropical cyclone counts are rising, or that global dust has increased every year.
1. Methods and Evidence Standards
This is a broad evidence synthesis, not a formal systematic review or meta-analysis. Searches emphasized observations published or updated through the evidence cutoff date. Priority went to peer-reviewed studies, global observing agencies, assessment bodies, public health institutions, and transparent data products. Secondary summaries were used mainly to locate original sources or explain technical findings.
The review began with the major climate subsystems and the primary and secondary consequence lists on Job One for Humanity. Those categories include greenhouse gases, atmospheric heat and moisture, oceans, ice, snow and albedo, the water cycle, drought, storms, circulation, wildfire, dust, carbon sinks, permafrost, biodiversity, health, food, water, infrastructure, finance, migration, and governance. The categories were then matched to current primary evidence. [S01, S02]
Six evidence labels
Evidence-label definitions
| Label | Meaning |
|---|---|
| A1 | Demonstrated temporal acceleration: the rate of change itself is shown to have increased through time. |
| A2 | Significantly higher recent rate: a later observational period or robust recent estimate is clearly higher than an earlier one, without claiming continuous acceleration. |
| N | Nonlinear response: each added increment of warming produces a disproportionate increase in the consequence or threshold response. |
| B | Strong worsening in frequency, severity, duration, scale, or burden, but no strict acceleration claim is required. |
| C | Regional, emerging, multi-driver, or method-sensitive evidence that is important but narrower. |
| D | Mixed, uncertain, projection-dominant, under active dispute, or no uniform observed acceleration established. |
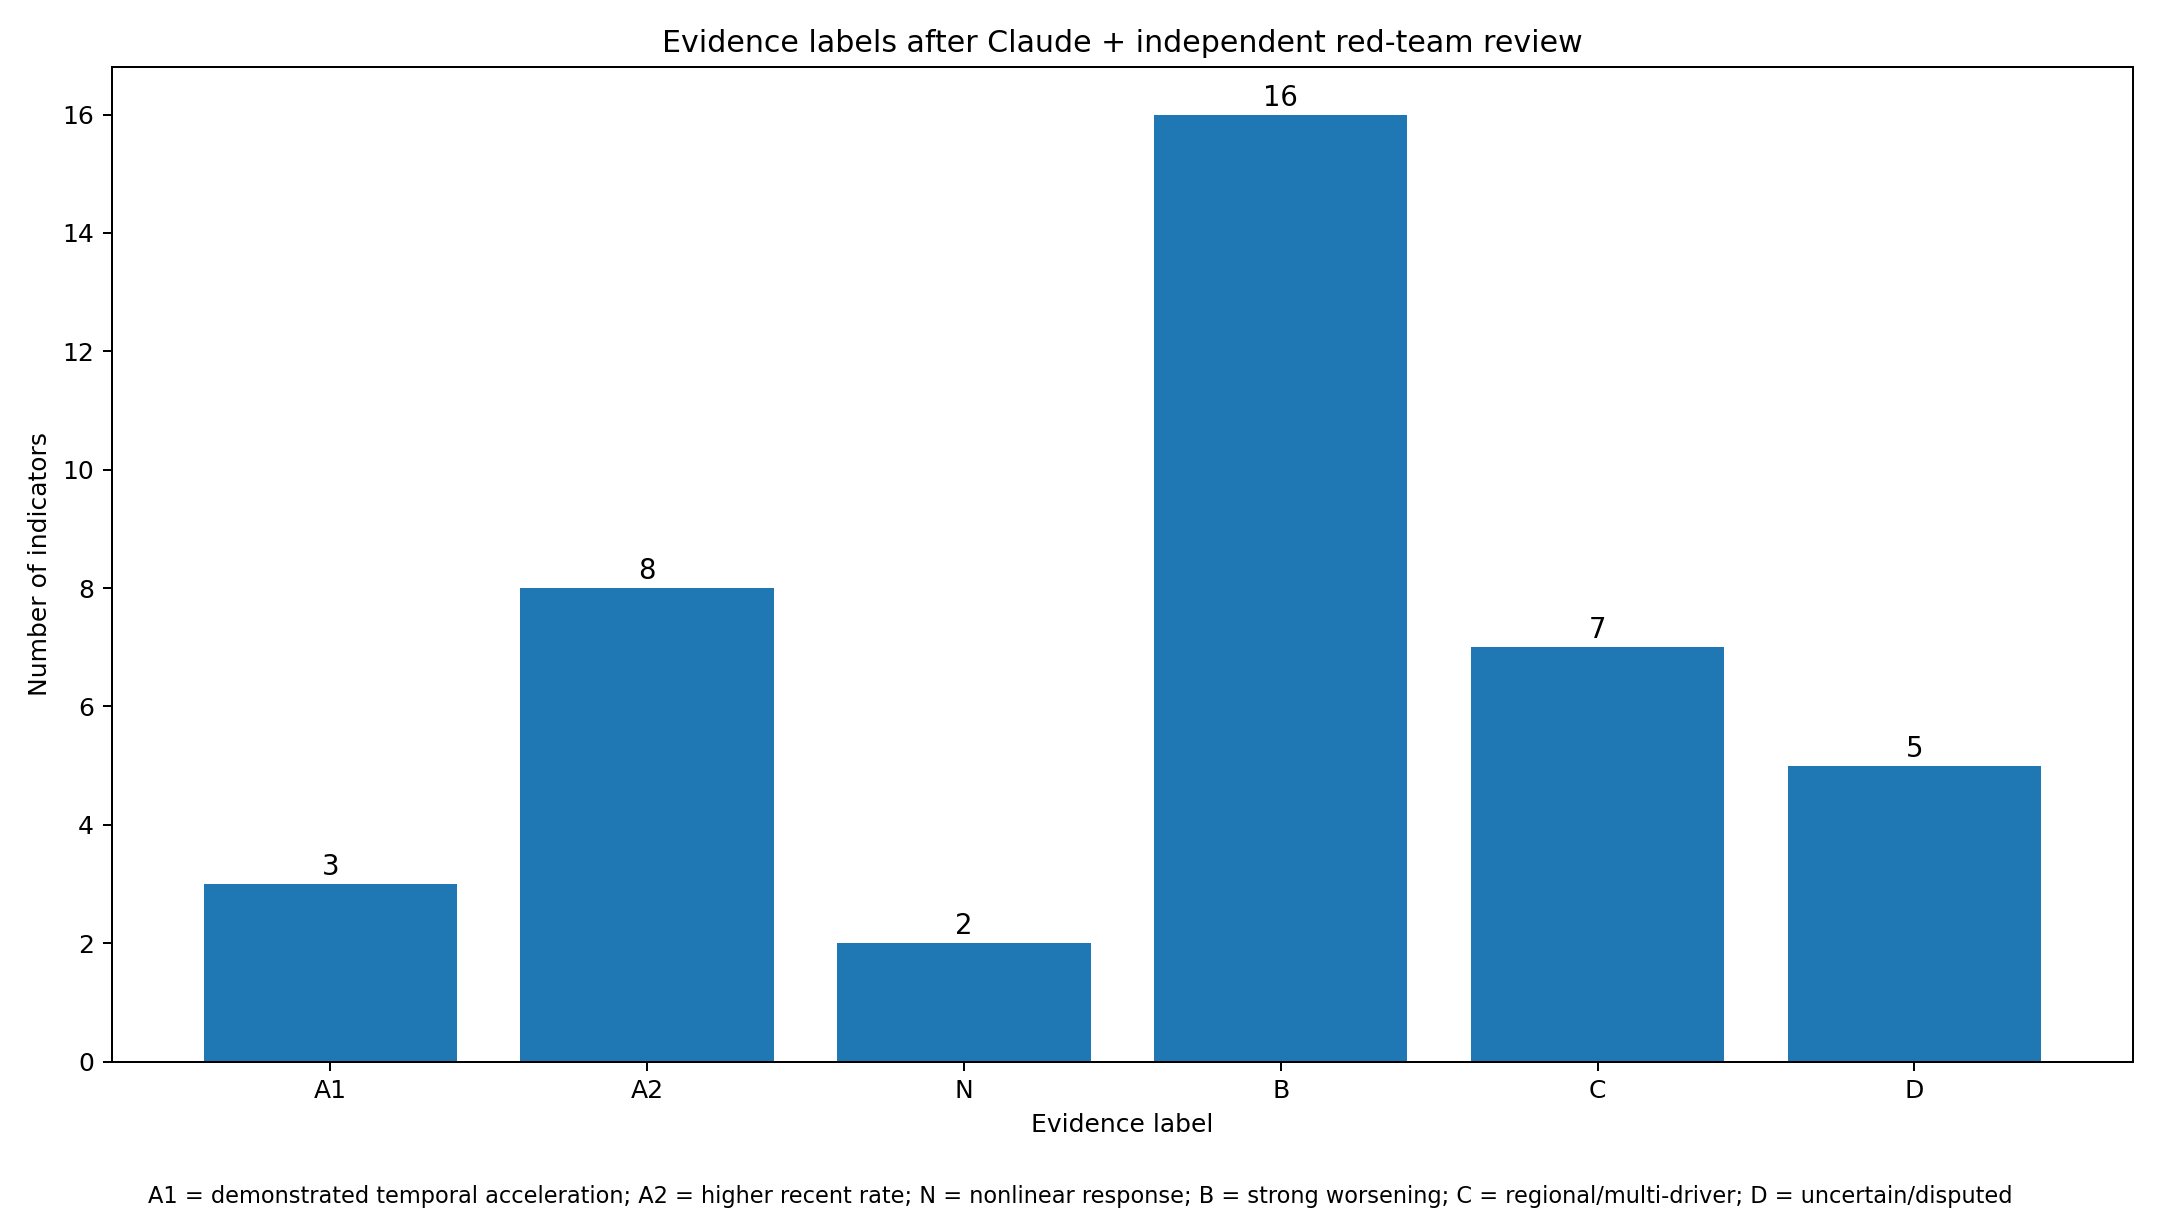
Fig. 2. Distribution of evidence labels Sources: [Evidence matrix]
Four distinct ways conditions can worsen
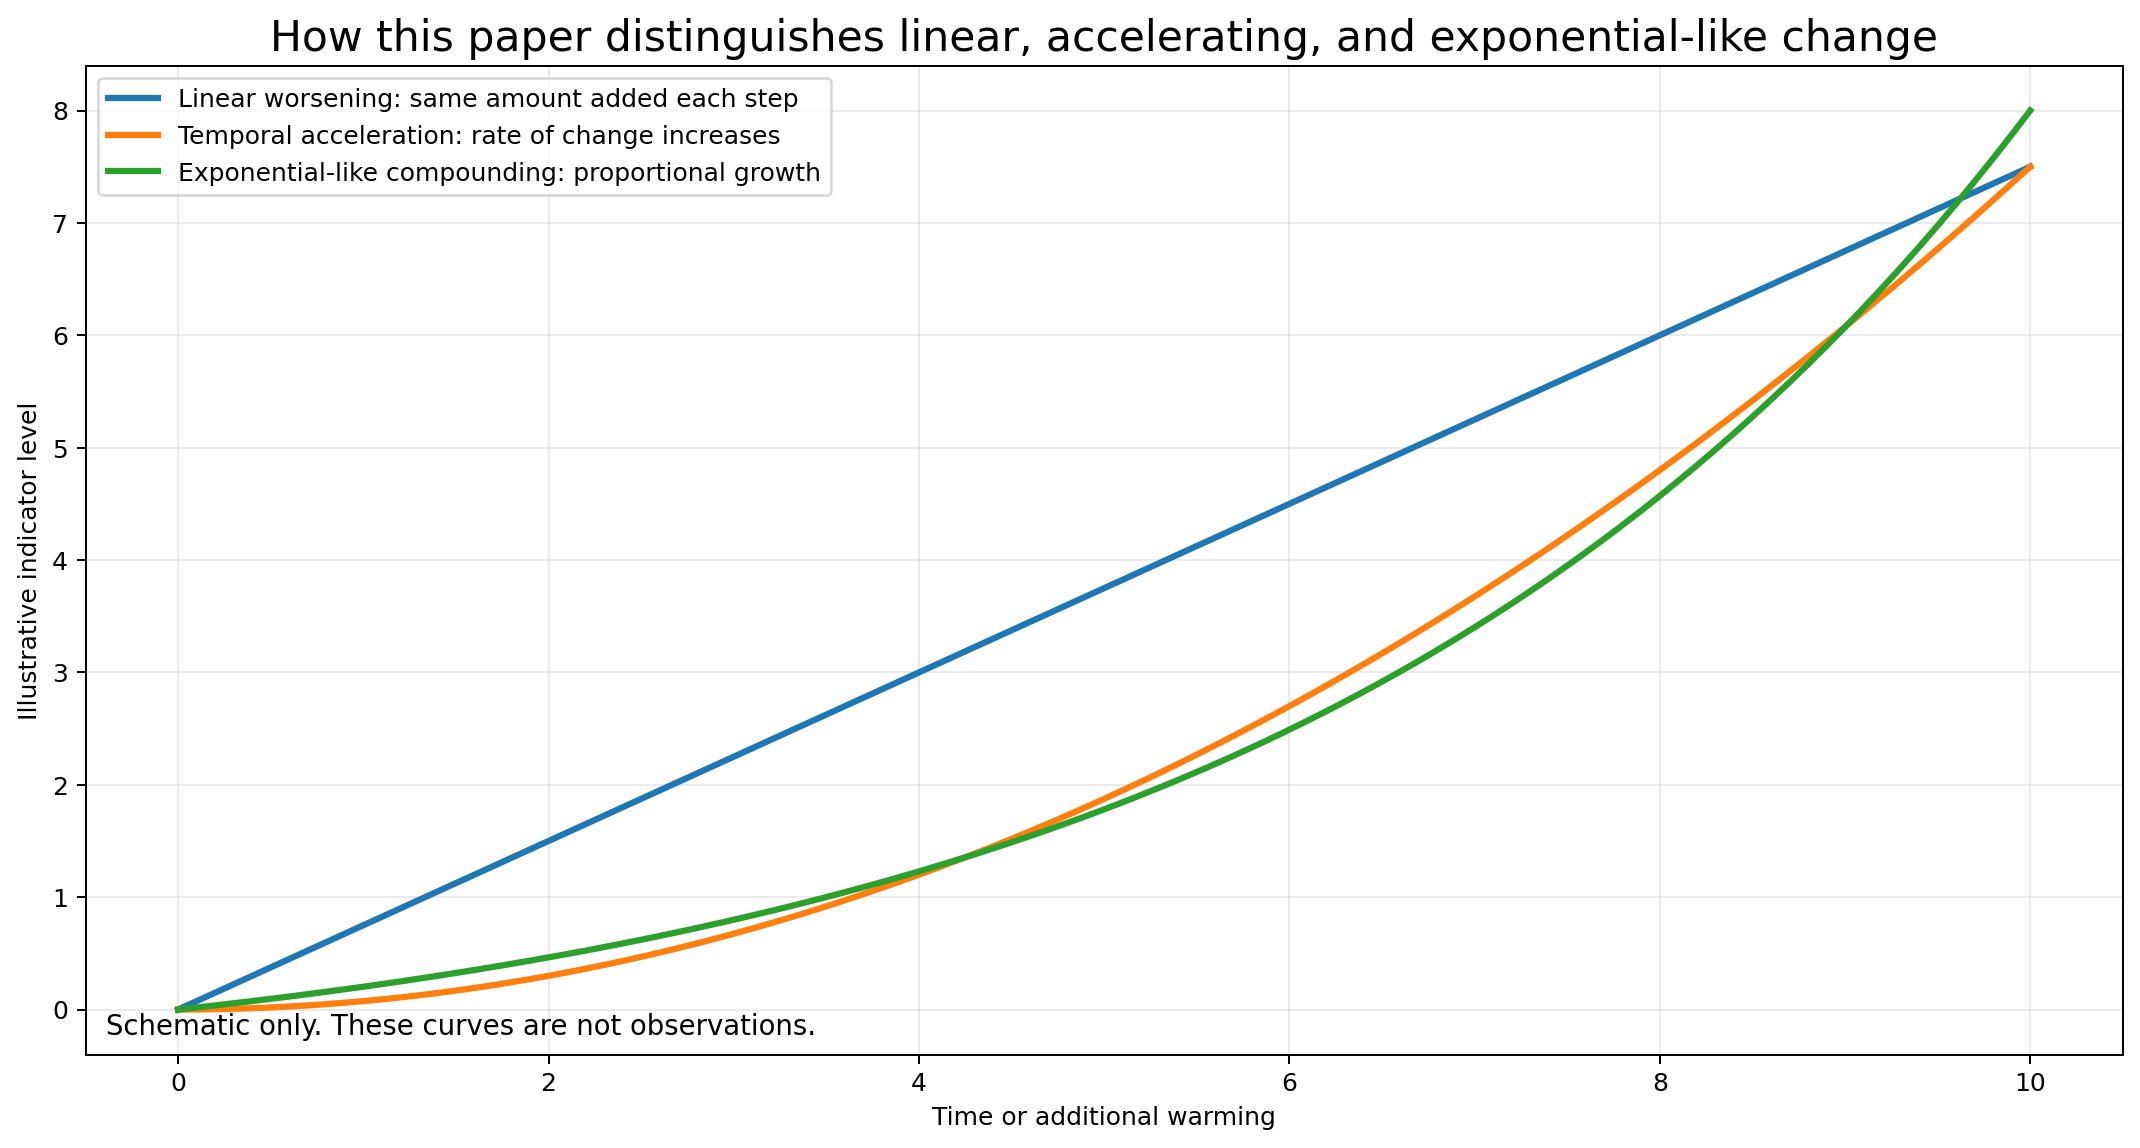
Fig. 3. Linear, accelerating, and exponential-like change Not observational data.
- Demonstrated temporal acceleration (A1): the rate itself is shown to be increasing, such as a statistically supported acceleration in sea-level rise.
- A higher recent rate (A2): a later observational period or adjusted statistical estimate is clearly higher than an earlier rate, even when a smooth second derivative cannot be estimated reliably.
- Nonlinear response (N): each additional increment of warming produces a larger change in a consequence, such as long-duration heatwave risk or threshold coastal flooding.
- Worsening burden (B, C, or D depending on evidence strength): frequency, severity, duration, scale, exposure, or losses increase, but the physical rate acceleration is not isolated or may remain uncertain.
Why this distinction matters
The public word accelerating often means getting worse faster. Science needs more precision. A higher recent level, a rising trend, a nonlinear response, and a mathematically accelerating rate are related but not identical claims.
The paper therefore uses the strongest label only when the evidence supports it. The paper therefore reserves its strongest labels for indicators that meet the stated evidentiary tests.
Source hierarchy and claim hygiene
- Source priority 1: direct observations and peer-reviewed analyses with stated methods and uncertainty.
- Source priority 2: WMO, NOAA, NASA, IPCC, WHO, and comparable institutional syntheses.
- Source priority 3: sector evidence such as reinsurance loss databases, used with explicit multi-driver caveats.
- Source priority 4: organizing or advocacy frameworks, used to structure questions but not to validate their own claims.
Each important claim is separated into observed finding, scope, evidence grade, and caveat. Confirmed measurements are kept separate from inferred causes. Global findings are not silently converted into local claims, and regional findings are not promoted to global laws. The full evidence matrix and source register are included with the downloadable research package.
Reasonable data variation and uncertainty
Climate indicators vary because the climate system is noisy, observations are incomplete, baselines differ, and methods make different tradeoffs. El Nino, volcanoes, aerosols, ocean circulation, fires, and regional weather can raise or lower individual years. A credible assessment therefore looks for agreement across independent records, uses ranges rather than false precision, and pays attention to the length and location of the record. [S03, S07, S08, S38]
Institutional assessments often emphasize central estimates and high-confidence findings. That protects against overstatement but can under-describe fast-moving tails, recently detected changes, and poorly monitored regions. New papers can reveal those tails, but they can also be method-sensitive or later revised. This paper uses both kinds of evidence: conservative assessments for the spine, newer studies for emerging acceleration, and explicit caveats where the science is still moving.
1A. How We Tried to Falsify the Acceleration Hypothesis
Because this review began with the hypothesis that important parts of climate change are accelerating, confirmation bias is a real methodological risk. We therefore searched not only for rising curves, but also for null trends, slowing trends, contradictory studies, natural-variability explanations, measurement artifacts, regional exceptions, and cases in which a consequence worsened even though strict temporal acceleration was not established.
A finding was downgraded when the strongest evidence depended heavily on a short time window, statistical adjustment, a disputed metric, a regional sample, or major non-climate drivers. Drought, wildfire, dust, groundwater, AMOC, and recent adjusted global warming are treated this way in the relevant sections. The aim is not to make every indicator support the thesis. It is to determine which indicators survive attempts to disconfirm it.
Pre-specified disconfirmation questions
- Does the trend survive different baselines and endpoints?
- Is it visible in raw observations, or only after statistical adjustment?
- Could internal variability plausibly produce the apparent change?
- Is the mechanism known, disputed, or still unresolved?
- Do independent datasets agree?
- Are non-climate drivers responsible for a substantial share of the consequence?
- Are there credible counterexamples showing stabilization, deceleration, or recovery?
2. The Heat-Loading Engine
The clearest way to understand climate acceleration is to follow energy. Greenhouse gases reduce the rate at which Earth loses heat to space. More heat then accumulates in the ocean, land, atmosphere, and melting ice. Surface temperature is the most familiar indicator, but Earth energy imbalance and ocean heat content are often better measures of the underlying pace because they integrate enormous amounts of energy and are less dominated by short-term weather noise. [S03, S07, S38]
2.1 Carbon dioxide: both the level and the growth rate rose
The Mauna Loa annual mean record rose from 315.98 ppm in 1959 to 427.35 ppm in 2025. NOAA's global annual mean reached 425.62 ppm in 2025. The rise is not simply a straight line. WMO reports that the average atmospheric increase was about 0.8 ppm per year in the 1960s and about 2.4 ppm per year in 2011-2020. The annual change from 2023 to 2024 was unusually large at about 3.5 ppm, influenced by continuing fossil-fuel emissions, natural variability, fire, and weaker land uptake during extreme warmth. [S04, S05, S41]
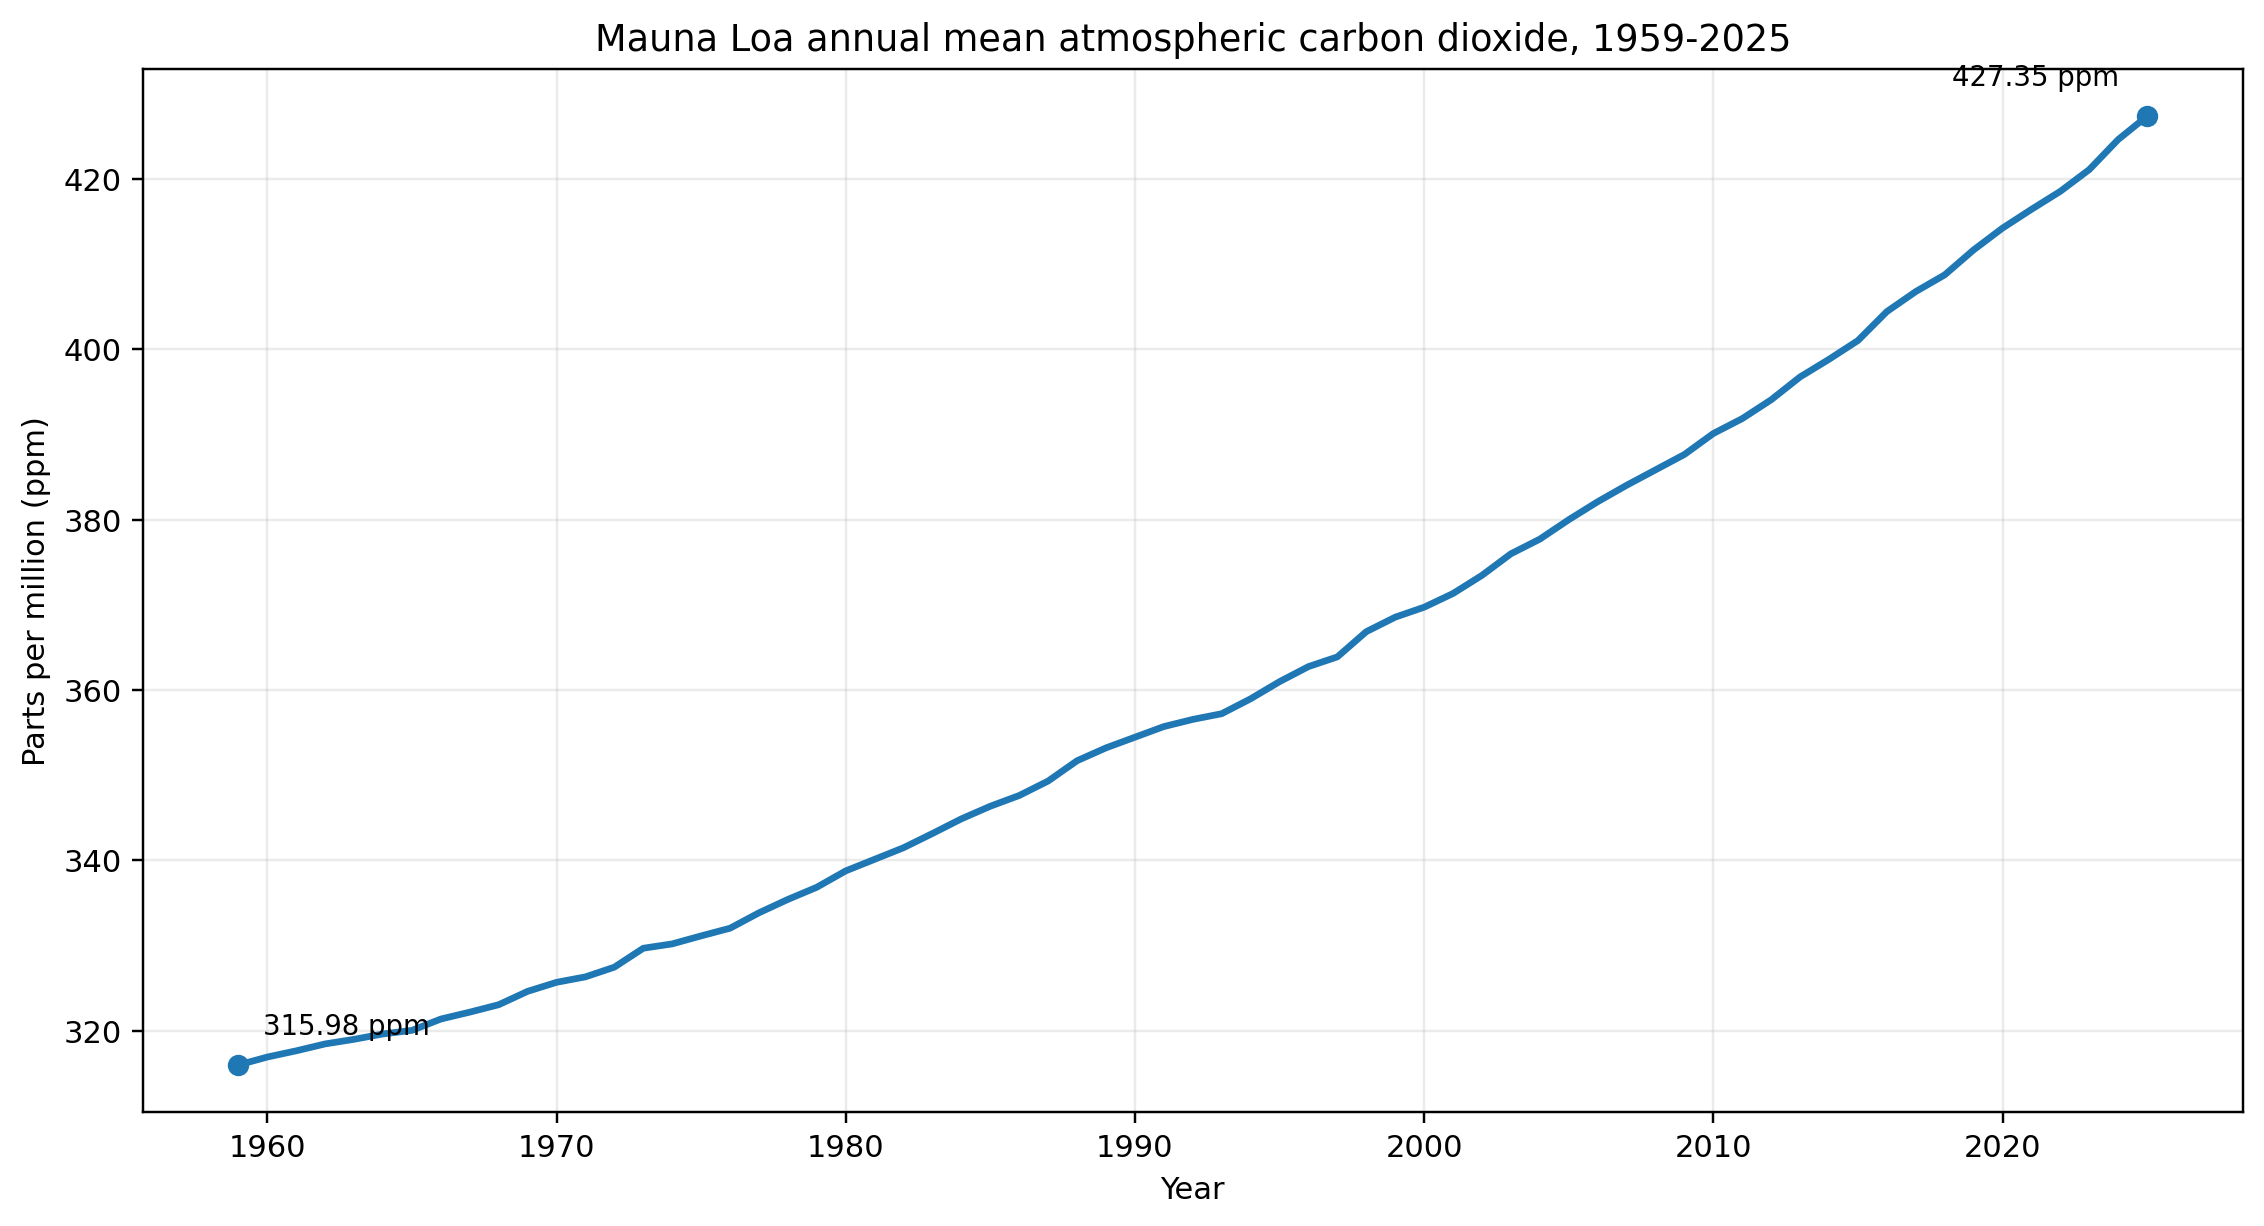
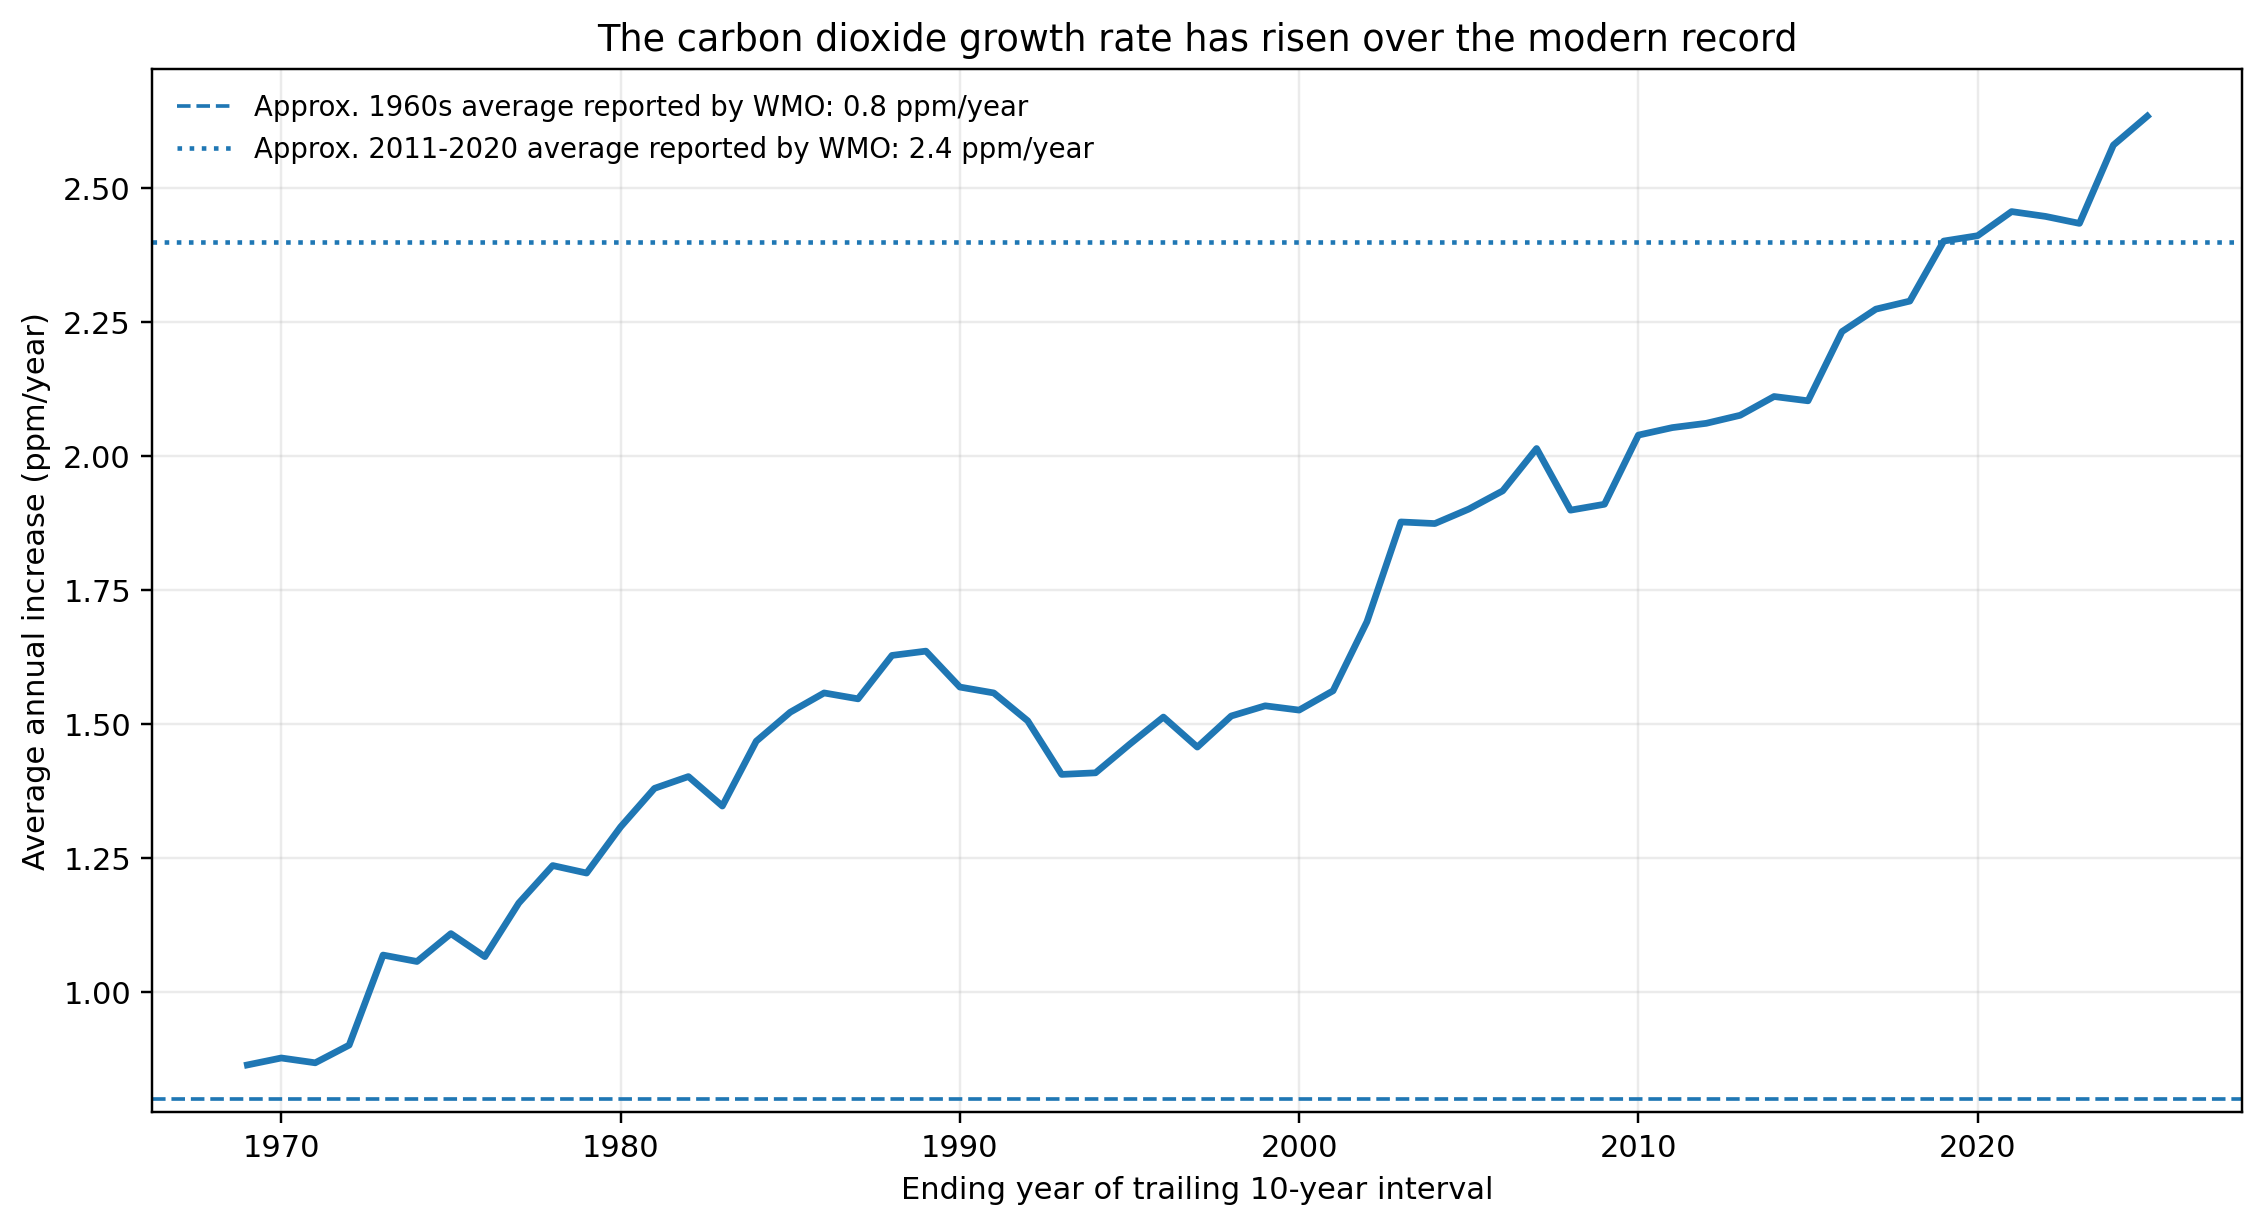
Fig. 5. Trailing ten-year carbon dioxide growth rate Sources: [S04, S41] Trailing ten-year rate computed from NOAA annual means; dashed reference levels are WMO decadal summaries.
Interpretation
The concentration curve is not a perfect exponential. Emissions, ocean uptake, land sinks, and climate variability all change over time.
The defensible claim is that both atmospheric CO2 and its multi-decade growth rate increased. That is direct evidence that the heat-trapping driver strengthened faster than it did in the early modern record.
2.2 Other greenhouse gases and forcing
Methane and nitrous oxide also reached unprecedented global concentrations in 2024. WMO placed methane at 1,942 ppb and nitrous oxide at 338.0 ppb. Long-lived greenhouse gas radiative forcing increased 54 percent from 1990 to 2024, with carbon dioxide responsible for most of the increase. These records show continuing worsening, although their annual growth rates fluctuate enough that one smooth acceleration curve would be misleading. [S04]
2.3 Global warming: a higher recent rate is now visible
NASA's observed temperature record shows the long climb clearly. Annual temperature jumps around because weather and ocean cycles redistribute heat, but the smoothed curve steepens after the late twentieth century. The 2015-2025 period contained the eleven warmest years in the instrumental record, and 2025 was about 1.43 degrees C above the 1850-1900 average in the WMO assessment. [S03, S06]
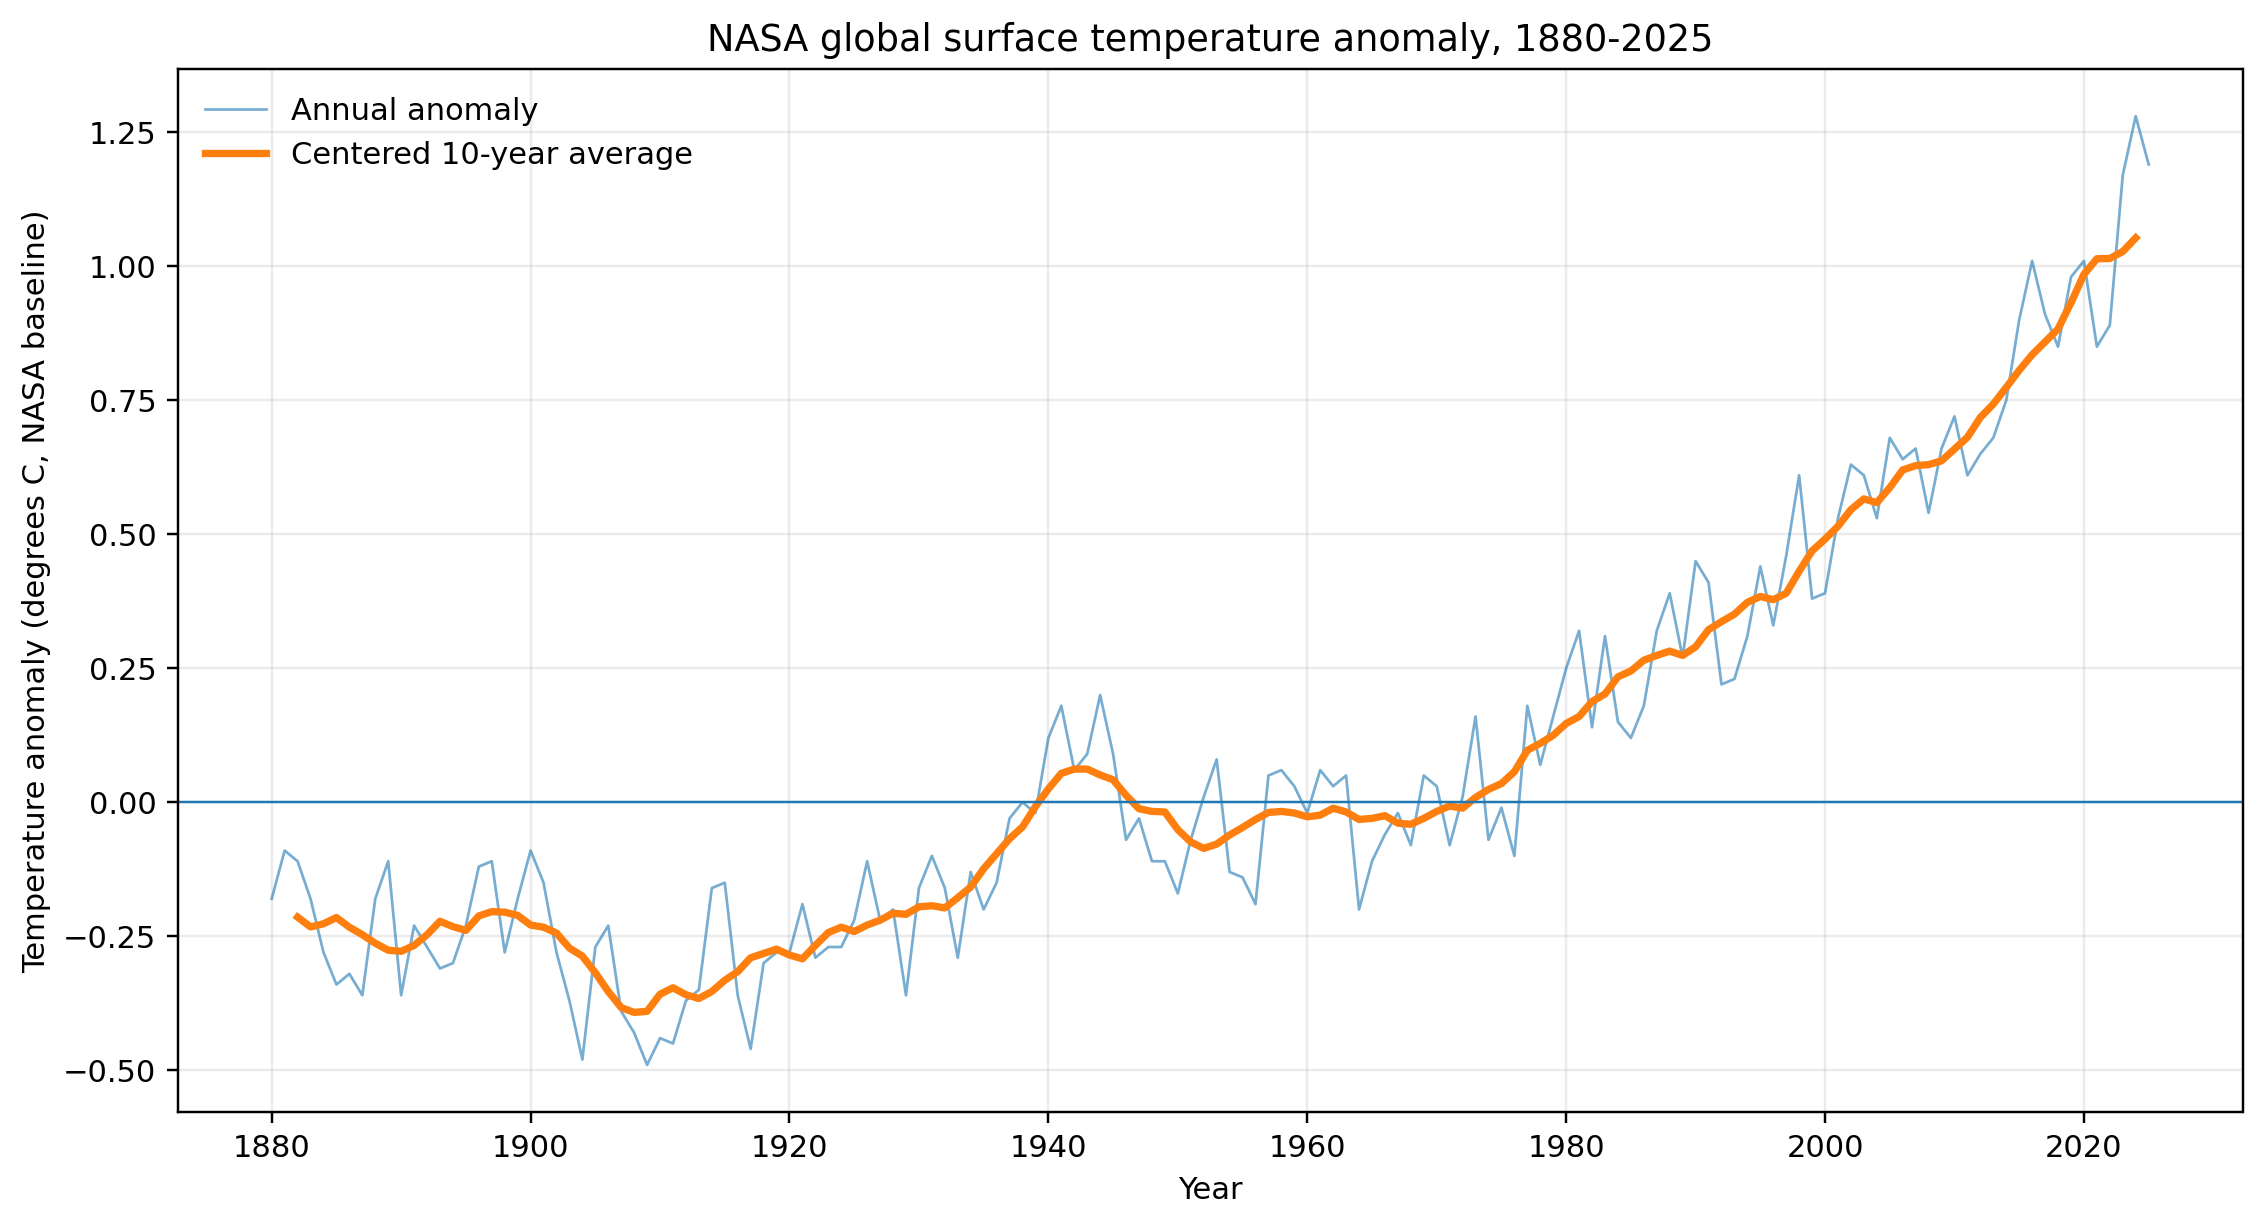
Fig. 6. Global surface temperature anomaly Sources: [S06] NASA GISTEMP anomalies use the 1951-1980 average as the zero baseline.
The annual Indicators of Global Climate Change assessment estimated human-induced warming at 1.37 degrees C in 2025 and a rate of 0.27 degrees C per decade over 2016-2025, with a likely range of 0.2-0.4. The observed rolling-decade rate was about 0.30 degrees C per decade. These are record-high assessed rates, but ten-year values still respond to the chosen endpoints and internal variability. [S07]
Foster and Rahmstorf used a different test. They adjusted five temperature records for El Nino, volcanic aerosols, and solar variability. The adjusted recent rates were about 0.34-0.42 degrees C per decade, with a statistically significant acceleration signal and a change point around 2013-2014. However, the raw global-mean temperature series did not itself show equally decisive acceleration, and subsequent scientific commentary has emphasized that short records, internal variability, and unresolved mechanism attribution limit what can be inferred about the future rate. For that reason, this paper classifies the result as A2: significantly higher recent rate after adjustment, not A1 demonstrated unqualified temporal acceleration. [S08, S44]
Why the mechanism matters. Several mechanisms may have contributed to the exceptional 2023-2025 warmth and rising energy imbalance. Goessling and colleagues linked much of the unexplained 2023 temperature jump to record-low planetary albedo associated largely with reduced low-cloud cover, while stressing uncertainty over how much reflects internal variability, aerosol reductions, or cloud feedback. Separate studies of the 2020 International Maritime Organization sulfur rules agree that reduced ship sulfate emissions produce a positive radiative forcing, but disagree on how much recent global warming can be attributed to that change. One model study estimated about +0.13 W/m2 forcing, while a larger-ensemble 2025 study found the resulting global surface-temperature signal was not distinguishable from internal variability to date. These are not alternatives to greenhouse forcing: aerosols have masked part of greenhouse warming, so reducing aerosol cooling can reveal warming already being driven by greenhouse gases. [S45, S46, S47]
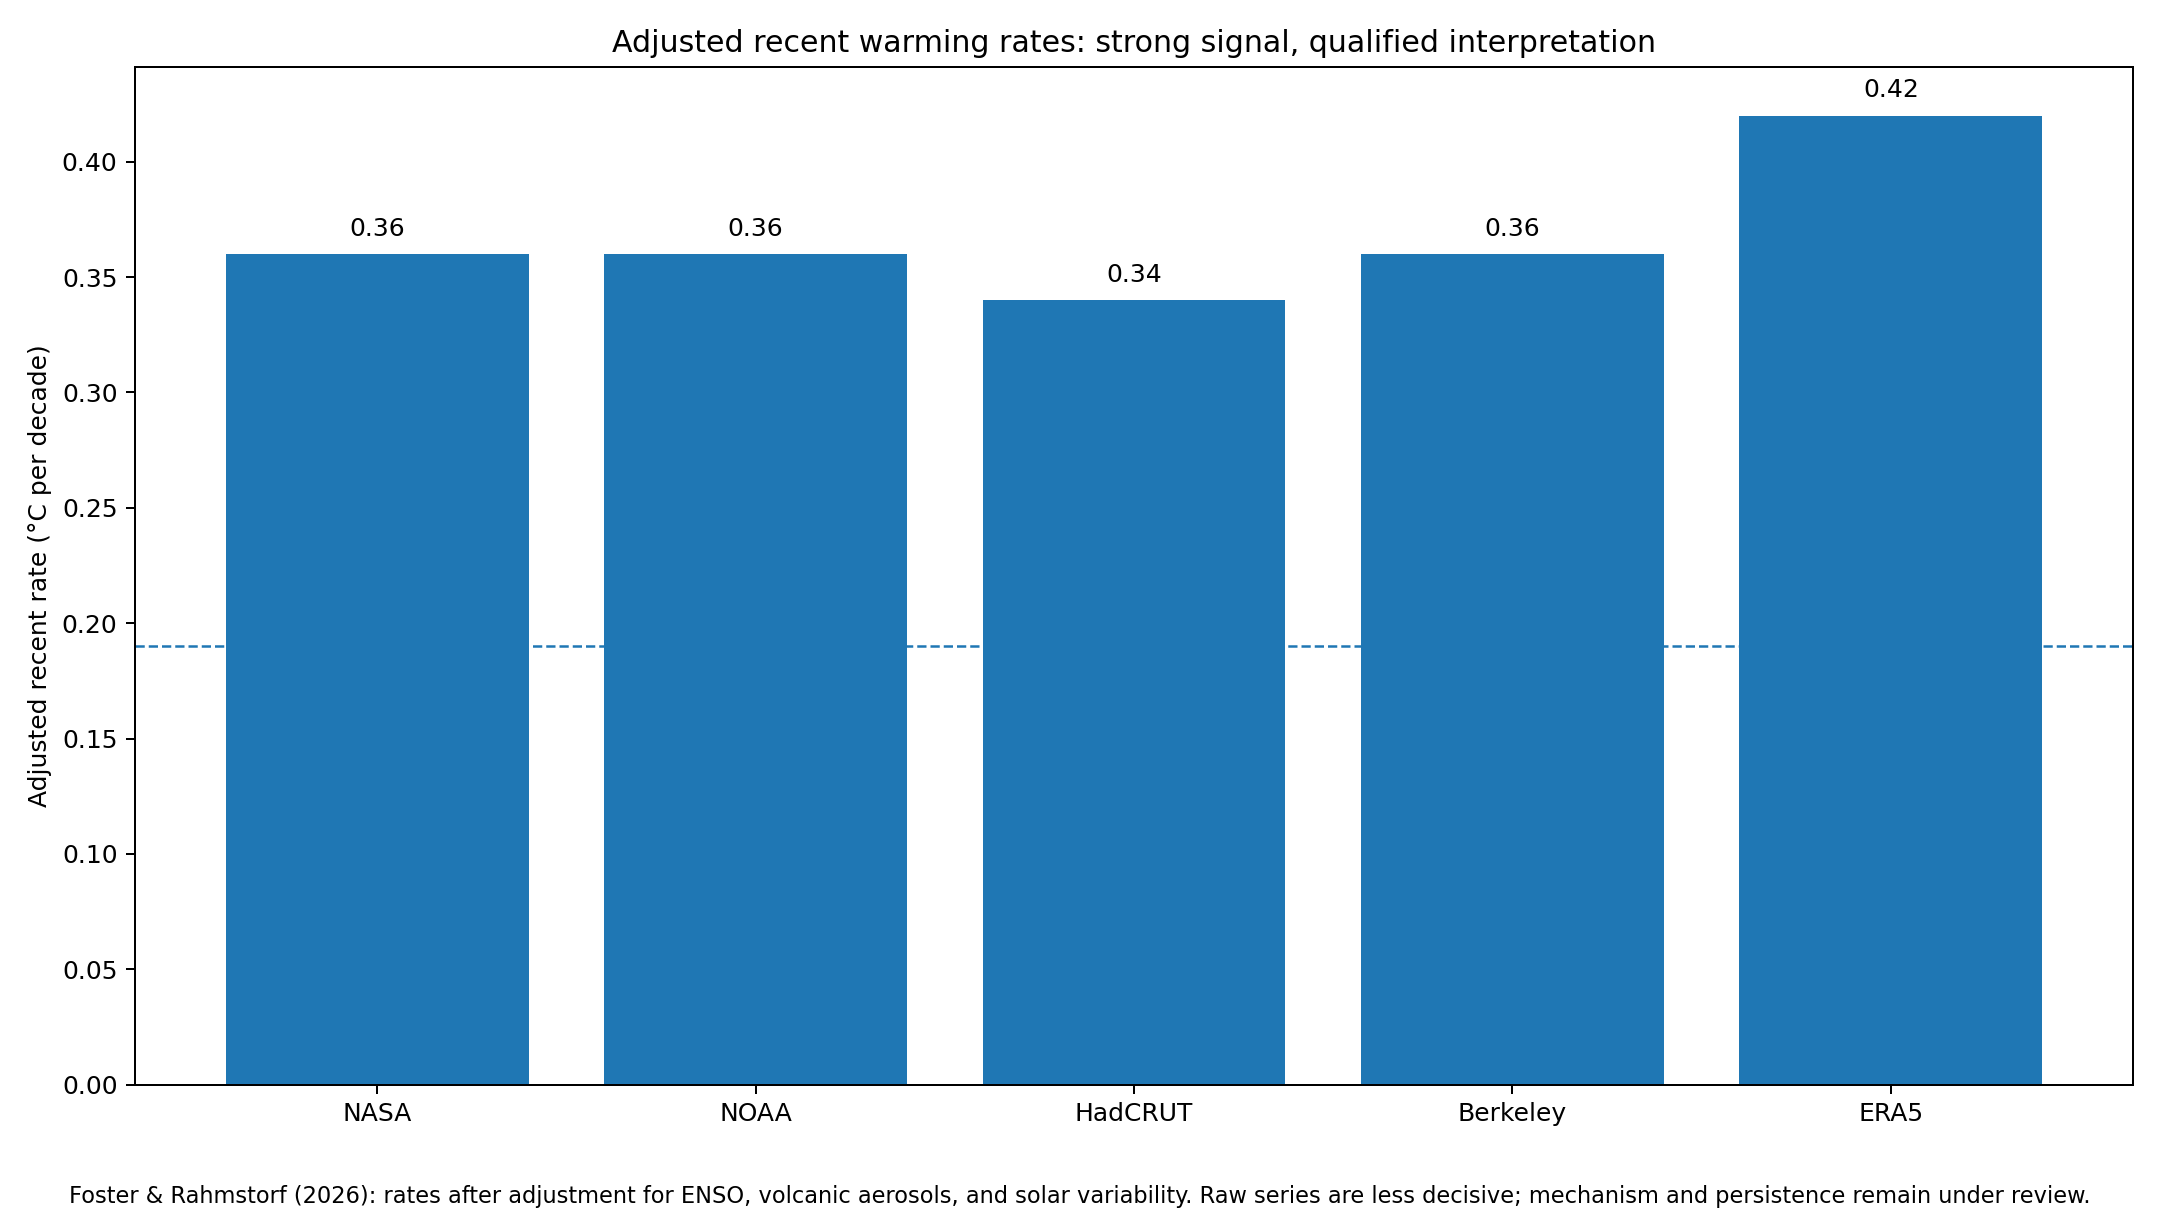
Fig. 7. Adjusted recent global warming rates, with qualification Sources: [S08, S44] Rates are calculated after adjustment for ENSO, volcanic aerosols, and solar variability. The raw series are less decisive; this figure supports an A2 higher-recent-rate classification, not an unqualified A1 claim.
2.4 Earth energy imbalance: the most important acceleration indicator
Earth energy imbalance measures how much more energy enters the climate system than leaves it. When the imbalance grows, the planet is not merely warm; it is accumulating heat faster. The 2025 global-indicator update concluded that the imbalance has more than doubled in recent decades. Ocean-based observations show a long-run acceleration of about 0.13 W/m2 per decade since 1960, while recent ocean and satellite estimates are about 0.30 and 0.44 W/m2 per decade over their shorter windows. [S03, S07]
Mechanism attribution remains active research. A larger energy imbalance is directly observed, but the recent increase can reflect several contributions operating together: rising greenhouse-gas forcing, reductions in cooling aerosols, changes in clouds and planetary albedo, and internal ocean-atmosphere variability. The observation that the imbalance increased is stronger than any single attribution claim about why it increased during a particular few-year interval. [S07, S45, S46, S47]

Fig. 8. Earth energy imbalance acceleration estimates Sources: [S03, S07] Different methods and time windows are shown side by side and should not be read as one continuous series.
Why this is the central finding
About 90 percent of the excess energy enters the ocean. The remainder warms land and air and melts ice.
A rising imbalance provides the energy source for multiple downstream accelerations: ocean heat, sea level, ice loss, atmospheric moisture, heat extremes, and ecosystem stress.
2.5 A moister atmosphere increases the fuel for extremes
Warmer air can hold more water vapor. Observations show that the atmosphere has become moister, with independent estimates around 1 percent per decade and 2 percent per decade over different periods and datasets. Water vapor is also a greenhouse gas, so it amplifies warming as a feedback. More moisture does not produce rain everywhere at all times. It raises the potential for heavier precipitation where storms lift and condense the moisture, while hotter conditions can still dry soils faster between events. [S09, S10, S38]

Fig. 9. Reported global atmospheric water vapor trends Sources: [S09, S10] Different datasets and windows; this figure shows consistent worsening, not a direct rate comparison.
3. Oceans and Coasts
3.1 Ocean heat content is accelerating
The upper 2,000 meters of the ocean accumulated about 3.05-3.91 zettajoules per year in 1960-2005. In 2005-2025, the rate rose to about 11.0-12.2 zettajoules per year. A zettajoule equals one sextillion joules (10^21 joules). [S03]

Fig. 10. Upper-ocean heat accumulation rate Sources: [S03] Bars use midpoints of reported multi-dataset ranges; error bars show half-range, not formal confidence intervals.
Faster ocean heating expands seawater, raises sea level, increases the energy available to marine heatwaves and some storms, reduces oxygen solubility, stresses marine food webs, and contributes to ice-shelf melt. This heat accumulation propagates through multiple connected climate subsystems. [S03, S07, S38]
The ocean is both an indicator and a buffer. By absorbing most excess planetary heat, the ocean slows near-term atmospheric warming compared with a world in which that heat remained at the surface. Changes in stratification, overturning, and vertical mixing can alter how efficiently heat is transferred into deeper layers. This does not mean the ocean will simply become "full" or suddenly stop taking up heat; rather, ocean uptake efficiency can change, affecting how quickly surface warming responds to the same top-of-atmosphere forcing. This stock-flow-delay relationship is important when interpreting short-term changes in atmospheric warming. [S03, S38]
3.2 Marine heatwaves are becoming far more common
The 2026 global-indicator update found that global marine heatwave days more than tripled between 1991 and 2025. That statement uses 1991 as the long-run comparison point. A separate decadal summary from the same indicator family shows the average increasing from 36 days in 2007-2016 to 58 days in 2016-2025, a rise of about 60 percent, while 2024 reached 82 days. These comparisons use different baselines and are therefore complementary rather than interchangeable. A separate PNAS study found roughly a threefold increase in persistence since the 1940s and about a 1 degree C rise in intensity. [S07, S13]

Fig. 11. Global mean marine heatwave days Sources: [S07, S13] A fixed 1985-2014 threshold is used; El Nino contributes to individual peaks.
Marine heatwaves can cause coral bleaching, fisheries disruption, kelp-forest loss, harmful algal blooms, oxygen stress, and changes in carbon exchange. El Nino helps produce individual peaks, but all major datasets show a pronounced upward shift beginning in the early 1980s. [S07, S13, S38]
3.3 Sea-level rise is accelerating
Global mean sea level rose about 11 centimeters between January 1993 and the end of 2025. More important for acceleration, the rate increased from 2.65 +/- 0.30 mm per year in 1993-2011 to 4.75 +/- 0.30 mm per year in 2012-2025. Thermal expansion and land-ice loss are the main drivers. [S03]

Fig. 12. Global mean sea-level rise rate Sources: [S03]
A nearly doubled mean rate can create much more than a doubled flood burden. Coastal flooding is a threshold process. Once ordinary tides approach the height of streets, drains, wetlands, or seawalls, a few additional centimeters can convert rare flooding into frequent flooding. This is one reason consequence curves can accelerate faster than the underlying sea-level curve. [S23, S38]
3.4 High-tide flooding shows threshold acceleration
NOAA reports that average U.S. high-tide flooding is now more than twice as frequent as in 2000 and that the national trend is accelerating. The Southeast Atlantic experienced increases over 400 percent, while a Western Gulf example exceeded 1,100 percent. These are regional figures, and land subsidence can intensify local relative sea-level rise, but the mechanism is clear: rising mean water levels cross fixed local thresholds. [S23]
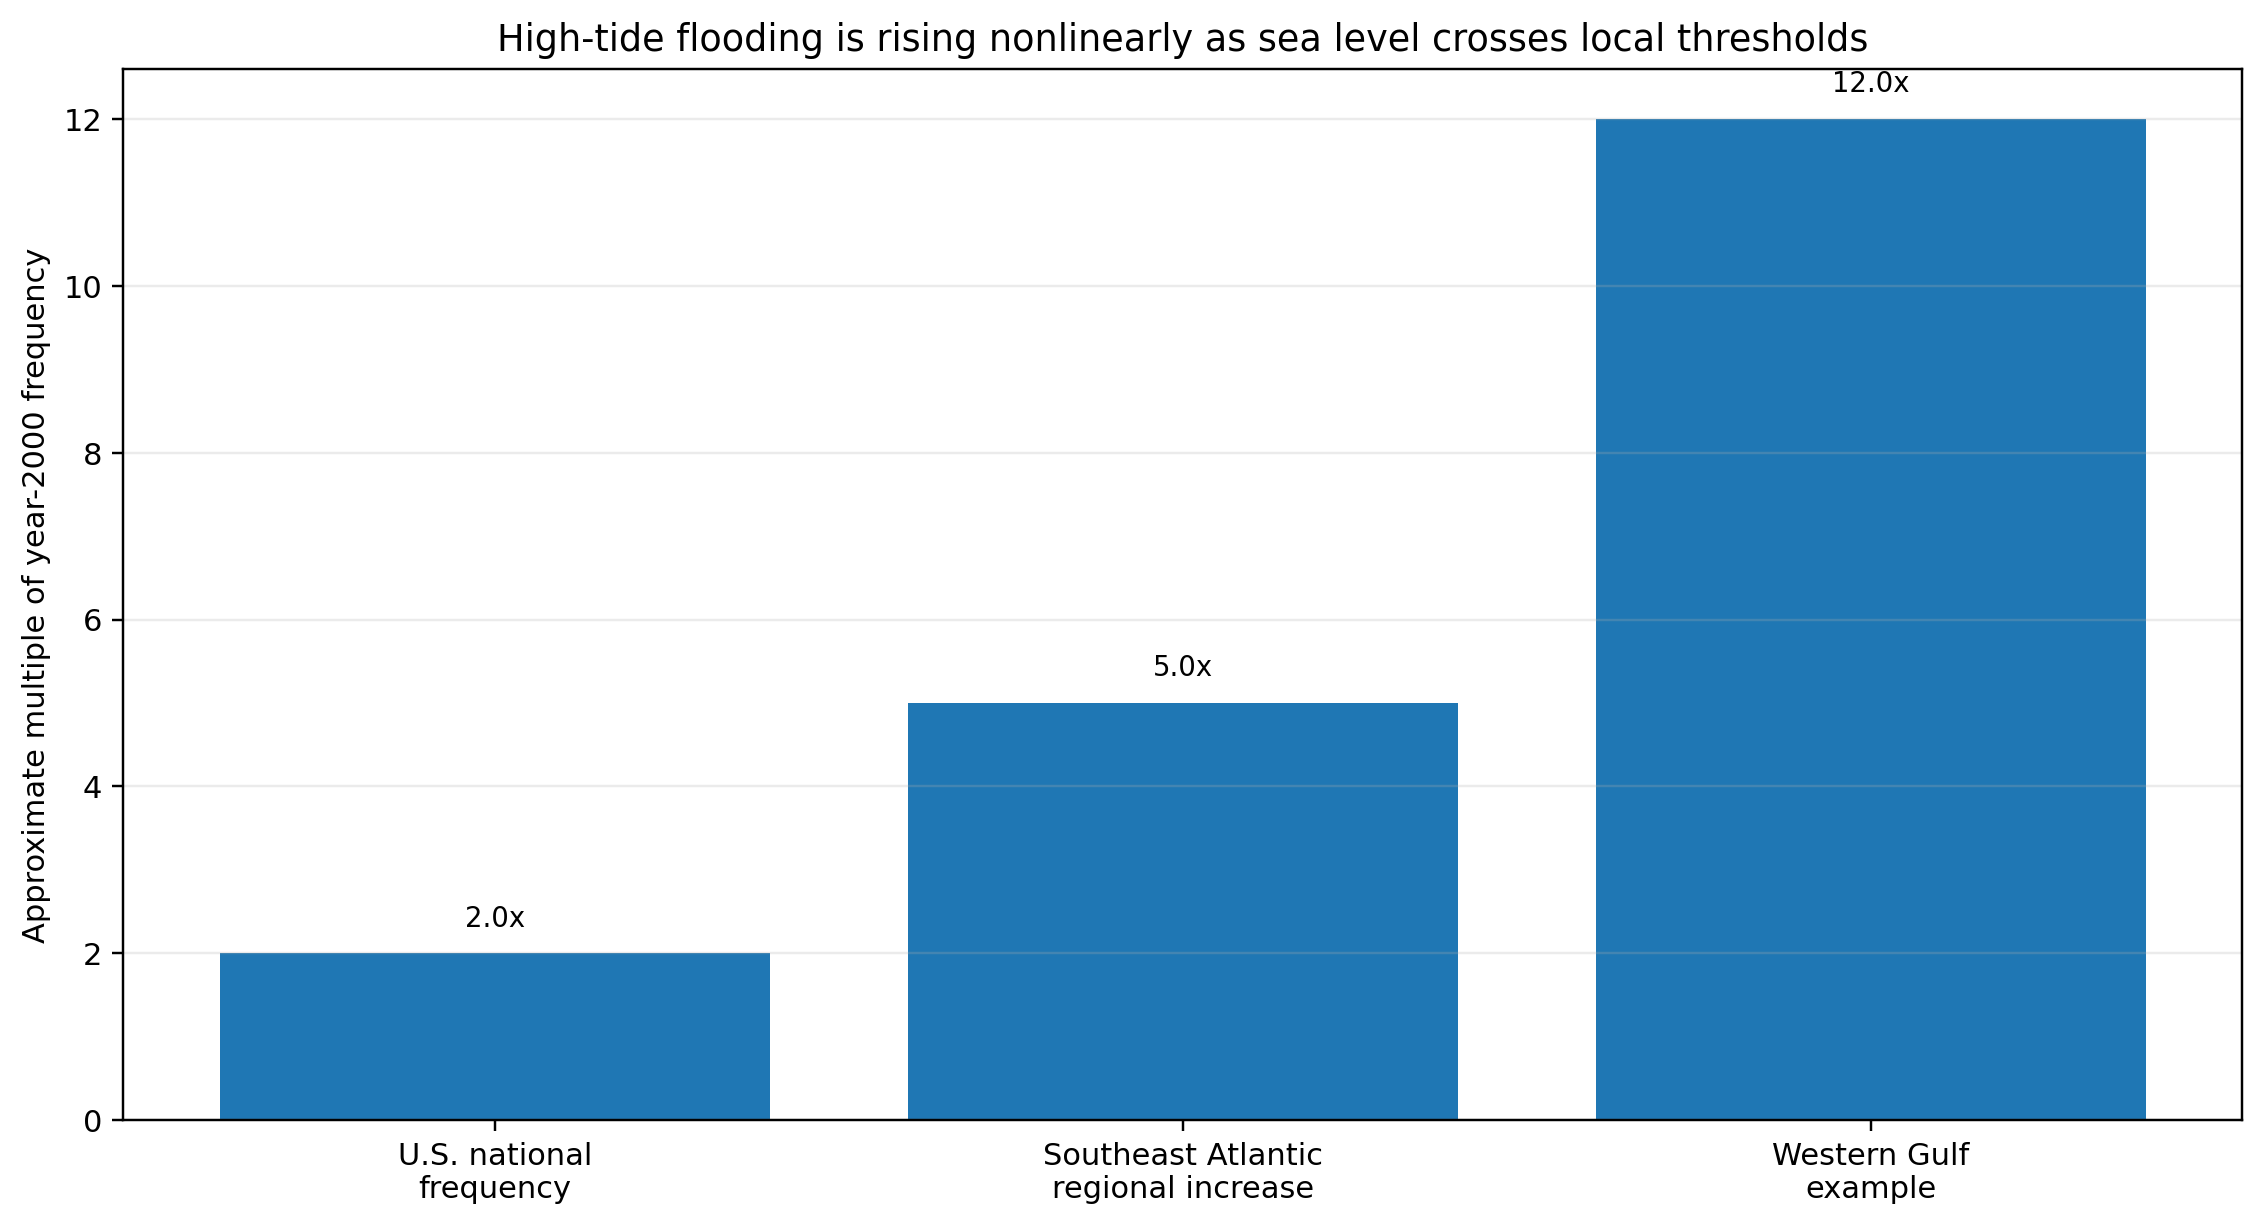
Fig. 13. High-tide flooding frequency increase Sources: [S23] Regional values are not national averages and include local relative sea-level effects.
3.5 Ocean acidification
The ocean absorbs a large share of human carbon dioxide emissions. That chemical uptake lowers pH. WMO reports a global mean surface-ocean pH decline of about 0.017 units per decade from 1985 to 2025, with nearly half of sampled ocean area acidifying faster than the global mean. The observed four-decade series is best described as a strong persistent worsening trend rather than as proof that the acidification rate itself is accelerating. [S03]
3.6 Ocean deoxygenation: less oxygen in a warmer ocean
Ocean warming reduces oxygen solubility and can strengthen stratification, limiting the renewal of oxygen-rich surface water in the ocean interior. Observations show a long-term decline in global ocean oxygen, while a 2024 historical-forcing model study found the simulated global oxygen-inventory loss increasing from 46.4 +/- 5.0 Tmol per decade in 1967-1994 to 116.8 +/- 6.6 Tmol per decade in 2002-2018. Importantly, the same study reports that observation-based upper-ocean products show a strong post-2002 decrease that exceeds the earlier-period decline, while the model itself underestimates recent deoxygenation. [S42]

Fig. 14. Ocean deoxygenation rate in a historical-forcing model Source: [S42] The bars are model-estimated global inventory-loss rates, not a raw global observational time series; observation-based products show an even stronger recent upper-ocean decline.
Regional observations reinforce the concern. A 2025 Nature Climate Change study found deoxygenation rates of about 0.41-0.47 micromoles per kilogram per year in Atlantic-influenced Arctic waters, roughly six times the global mean, with amplified Arctic warming identified as the primary driver. This is a strong regional signal, not a license to generalize the same rate to the entire ocean. [S43]
Acidification, deoxygenation, and heat act together. A species that might tolerate one stress can fail under three, which is why isolated-variable thinking understates ecological risk. [S03, S38, S42]
3.7 Coral bleaching is expanding in scale
NOAA Coral Reef Watch estimated that the 2023-2025 fourth global coral bleaching event affected about 84.4 percent of the world's reef area in at least 83 countries and territories. The preceding 2014-2017 global event affected about 68.2 percent. Two events cannot define a smooth mathematical acceleration curve, but the expansion in geographic scale is an unmistakable escalation. [S14]
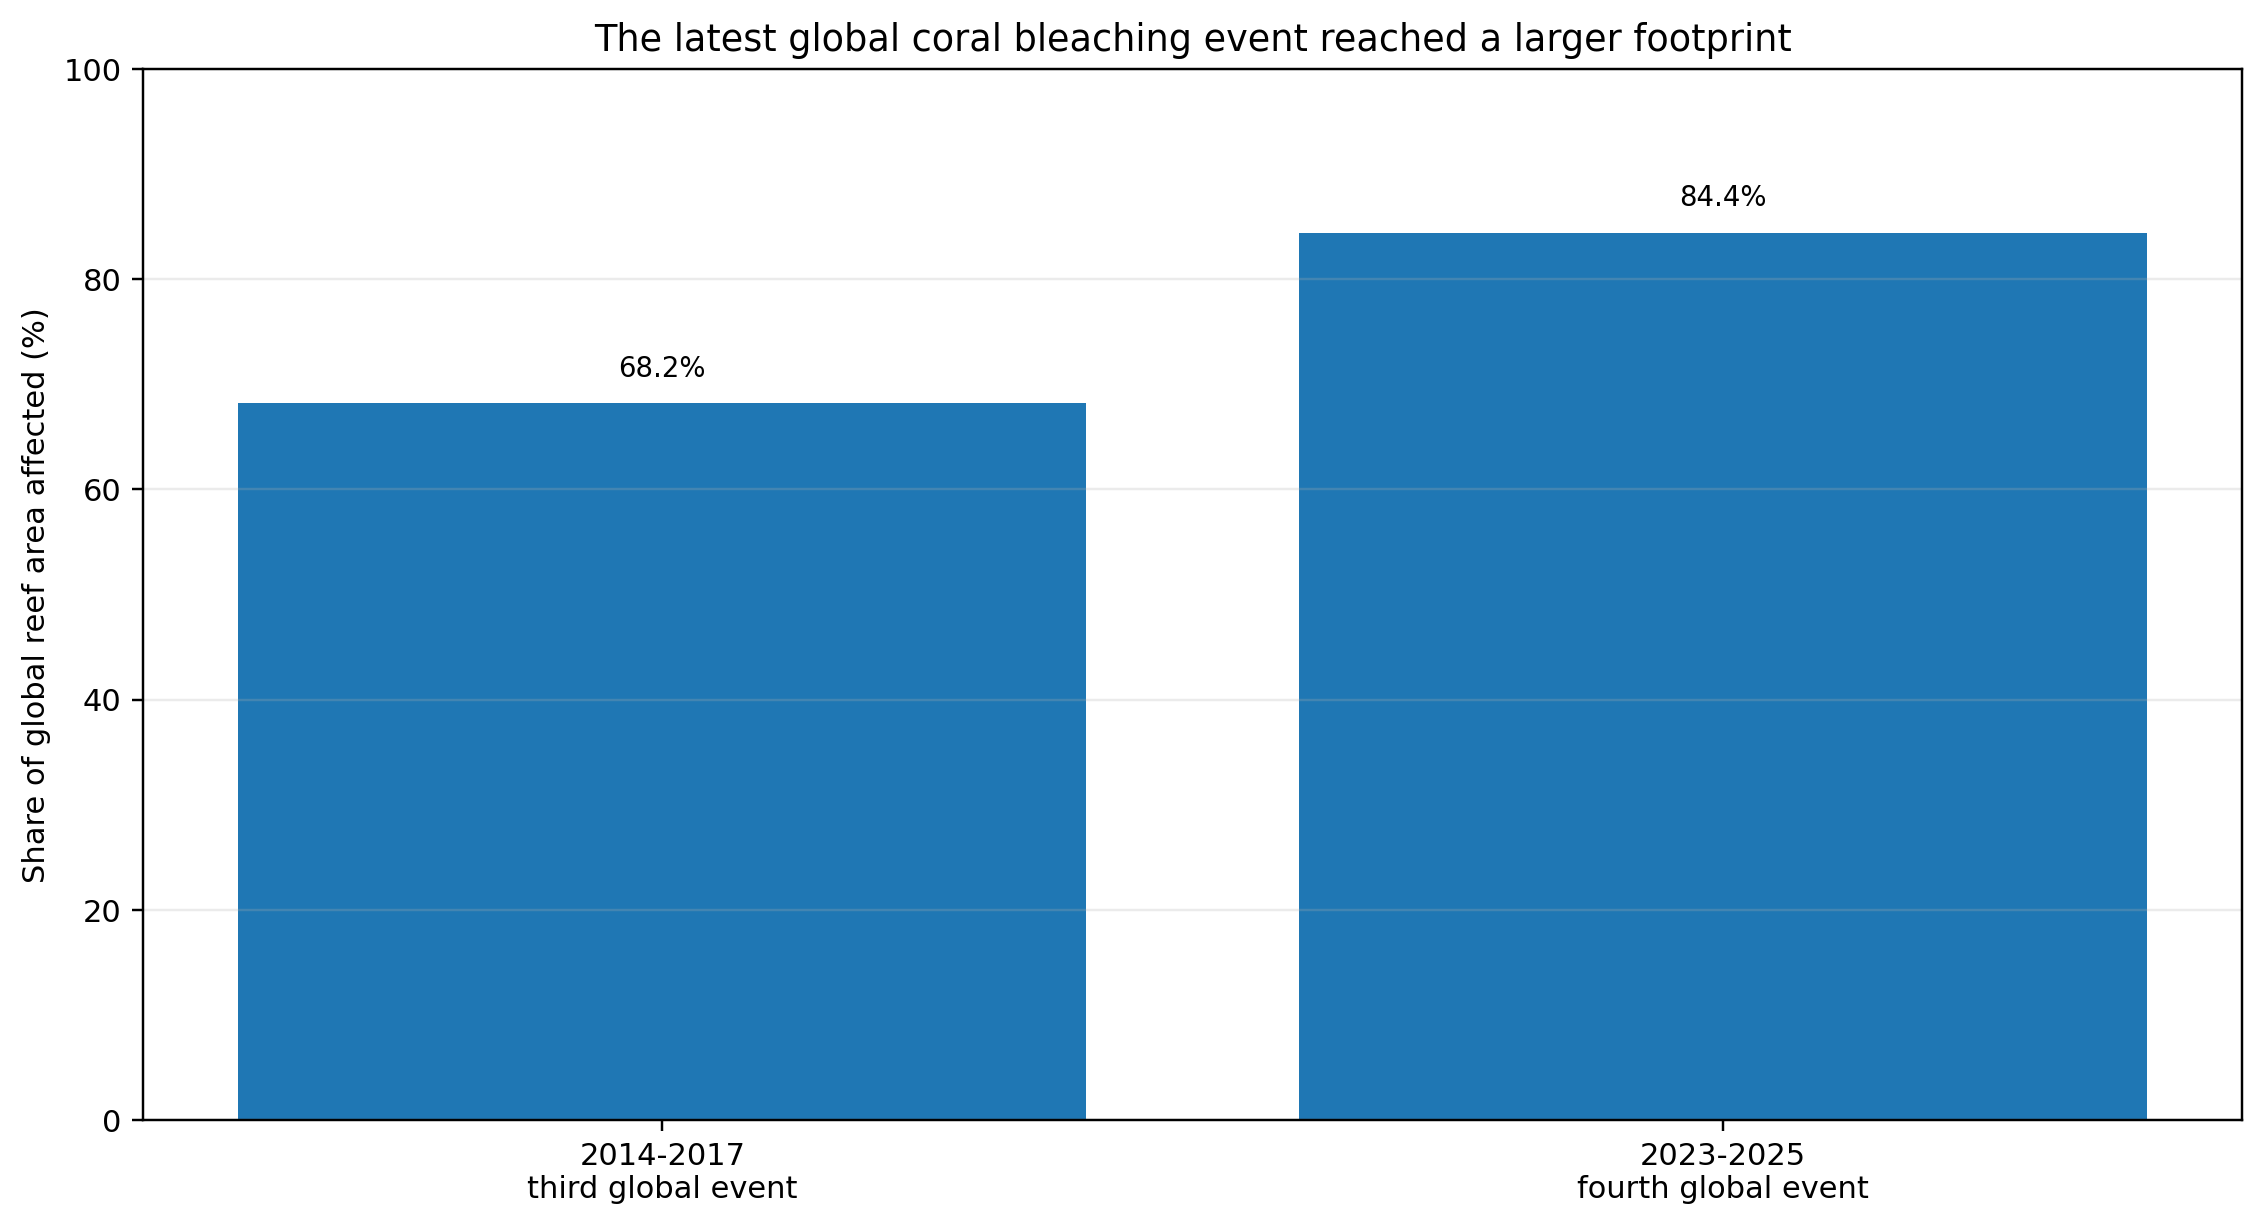
Fig. 15. Global coral bleaching footprint Sources: [S14] Two events show escalation in scale but do not form a continuous acceleration series.
4. Ice, Snow, and Albedo
4.1 Glacier loss accelerated
The GlaMBIE community assessment combined many observation methods and found that global glacier loss increased from 231 +/- 23 Gt per year in 2000-2011 to 314 +/- 23 Gt per year in 2012-2023. That is a 36 +/- 10 percent acceleration. Six of the seven highest annual glacier-loss years in the updated record occurred in the last seven years. [S15, S39]

4.2 Ice-sheet loss more than tripled
The combined Greenland and Antarctic ice-sheet loss rate increased from about 105 Gt per year in 1992-1996 to about 372 Gt per year in 2016-2020. The long-term acceleration is clear even though individual years vary because snowfall and melt can temporarily offset or amplify dynamic ice loss. [S16]

Fig. 17. Combined ice-sheet mass-loss rate Sources: [S16]
4.3 Arctic sea ice: structural decline with a recent trend caveat
Arctic September sea-ice extent declined about 12 percent per decade over the full satellite record. The last nineteen years contain the nineteen lowest September minimum extents. The ice also became much younger and thinner: ice older than four years declined about 95 percent relative to the 1985-2004 average. [S17, S18, S40]
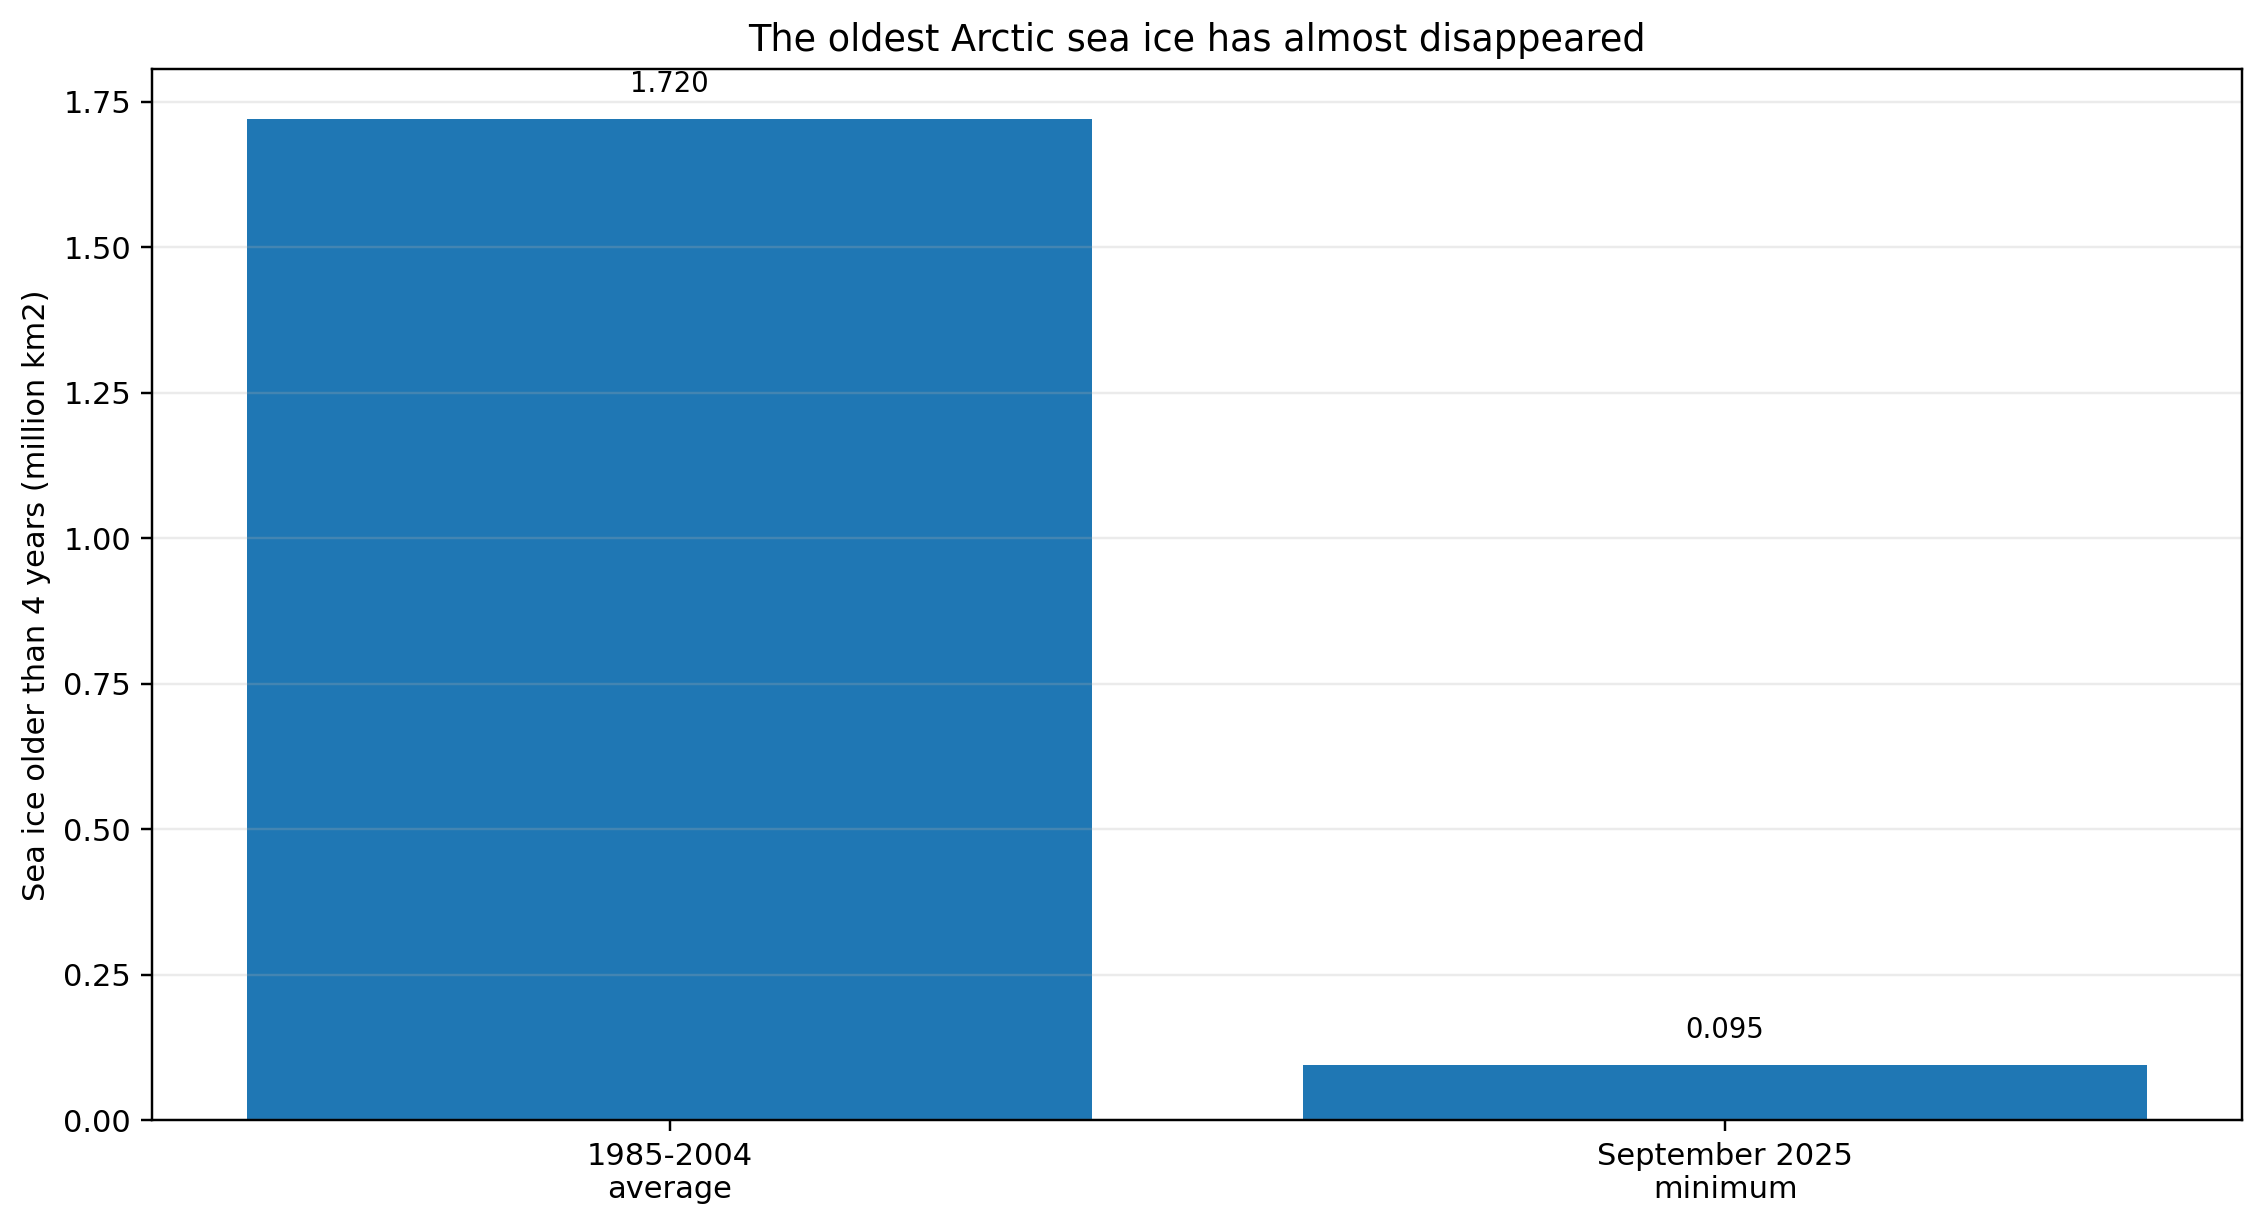
Fig. 18. Old Arctic sea ice area Sources: [S18, S40] The periods differ: a historical multi-year average is compared with the 2025 seasonal minimum.
The caveat is important. September minimum extent has not shown a statistically significant downward trend over roughly the most recent two decades. That pause does not erase the long decline or the loss of old ice, but it means the strongest statement is structural degradation and long-run loss, not continuous acceleration in every sea-ice metric. [S17, S18]
4.4 Snow cover and the albedo feedback
Arctic June snow cover is now about half its 1960s extent, and sea-ice melt onset is occurring about 4.1 days earlier per decade. Bright snow and ice reflect sunlight. Dark land and ocean absorb more. Their loss therefore creates a reinforcing albedo feedback that adds regional heat, accelerates melt, and changes ecosystems. The strength varies by season and location, but the direction is physically well established. [S18, S40]
5. Water-Cycle Acceleration and Land Drying
5.1 Hydroclimate whiplash
A warmer atmosphere can increase both water demand and heavy-rain potential. The result is not simply a wetter or drier world. It is a more volatile one. A major review estimated that global subseasonal wet-to-dry and dry-to-wet whiplash increased 31-66 percent since the mid-twentieth century, while interannual whiplash increased 8-31 percent. [S19]

Fig. 19. Observed increase in hydroclimate whiplash Sources: [S19] Ranges reflect alternate datasets and definitions.
Whiplash damages systems that are built for a stable range. Drought hardens or removes vegetation, then heavy rain runs off faster, carries sediment, and overwhelms drainage. Floods can be followed by water shortages because reservoirs, soils, aquifers, treatment plants, and farms respond on different schedules. [S19, S38]
5.2 Drought: serious worsening, but a key acceleration paper is under editorial review
A 2025 Nature paper reported that increased atmospheric evaporative demand raised average global drought severity by about 40 percent and that drought-affected area in 2018-2022 was 74 percent larger than in 1981-2017. However, on May 14, 2026, Nature added an Editor's Note stating that the paper's conclusions are subject to criticisms and corrections being considered by the editors. Because that review remains unresolved at this paper's evidence cutoff, these numerical findings are retained only as qualified emerging evidence and are not used as a headline proof of climate acceleration. [S20]
The wider assessment literature still supports increasing drought risk in many regions as warming raises evaporative demand, while drought trends depend strongly on region, season, precipitation, soil moisture, vegetation, and the drought definition used. Drought is therefore classified here as mixed-to-emerging acceleration evidence rather than as a Tier 1 global acceleration indicator. [S38]
Drought is not one thing. Meteorological drought concerns precipitation, agricultural drought concerns soil moisture and crop stress, and hydrological drought concerns rivers, reservoirs, and groundwater. Some regions become wetter. Heat can make a given rainfall deficit more damaging, but a global drought claim requires careful definition and method testing. [S38]
5.3 Drylands expanded
The UN Convention to Combat Desertification found that 77.6 percent of global land experienced a drier climate in 1991-2020 than in the prior thirty-year period. Drylands expanded by about 4.3 million square kilometers, increasing from 37.5 to 40.6 percent of land excluding Antarctica. This is a climatic aridity result. Desertification is broader and also depends on land use, soil degradation, grazing, deforestation, and water management. [S21]

Fig. 20. Expansion of global drylands Sources: [S21]
5.4 Groundwater decline: acceleration exists, but pumping matters
A global analysis of about 170,000 monitoring wells found that 30 percent of 542 aquifers with comparable records showed accelerating decline. Twenty percent showed slowing decline, 16 percent shifted from decline to recovery, and 13 percent continued rising. This is exactly the sort of result that rewards precision: the problem is widespread, acceleration is common, and recovery is possible, but there is no single universal aquifer trajectory. [S22]

Fig. 21. Groundwater trend categories Sources: [S22] Groundwater is a multi-driver system strongly affected by pumping and management.
Pumping is often the most direct cause. Climate change can reduce recharge, increase irrigation demand, and intensify drought, but it should not be used as an alibi for bad water governance. Both drivers matter, because the climate system can produce overlapping wet and dry extremes across different places and times. [S22]
5.5 River flooding: serious, but no uniform global acceleration
Heavy precipitation has intensified in many regions, and flood exposure has grown. Yet river flooding depends on basin size, soil moisture, snowmelt, dams, channels, land cover, drainage, and development. The IPCC did not establish a uniform global trend in all river-flood magnitude or frequency. Local and regional acceleration can be real without a single global curve. [S38]
A necessary correction to simplistic messaging
Rising flood losses do not automatically prove rising flood hazard. More people and assets in floodplains can raise losses even without a stronger river-flow trend.
Conversely, a mixed global average does not protect a region where heavy rain, sea level, snowmelt, or watershed damage is worsening.
6. Heat, Storms, and Atmospheric Circulation
6.1 Long heatwaves show a nonlinear response
Heat extremes rise faster than the average temperature in several practical senses. A small shift in the average moves many more days across fixed danger thresholds. The 2025 Nature Geoscience study found that long-duration heatwave changes increase nonlinearly with warming. Each increment of regional warming increases the characteristic duration scale more than the prior increment, and the rarest long events show the largest probability increase. [S11]
This is one of the strongest examples of a consequence moving from approximately linear physical warming toward faster nonlinear risk. It does not mean every heatwave lengthens exponentially each year. It means the probability distribution changes so that long, rare events can grow much faster than the mean. [S11]
6.2 Humid heat is intensifying
Wet-bulb temperature combines heat and humidity and is more closely related to the body's ability to cool by sweating than dry-bulb temperature alone. A global regional analysis found rising extreme wet-bulb temperatures in most land regions from 1979 to 2019. About half of the regions had statistically significant increases greater than 0.5 degrees C, including several already-hot tropical regions. [S12]
Humid heat is not uniform. Local moisture, irrigation, precipitation, land cover, and circulation matter. The global finding is worsening exposure, with regional rates and mechanisms that differ. [S12]
6.3 Tropical cyclones: fewer simple claims, stronger specific evidence
A robust increase in the total global number of tropical cyclones has not been established. The more defensible acceleration evidence concerns particular storm properties. NOAA's assessment finds evidence that the probability of rapid intensification increased in several basins. A 2024 study found a significant increase in mean nearshore intensification over 1979-2020, amounting to about 3 knots per 24 hours across the period. This is evidence of a higher recent intensification rate, not proof that the change followed one smooth accelerating curve. [S24, S25]
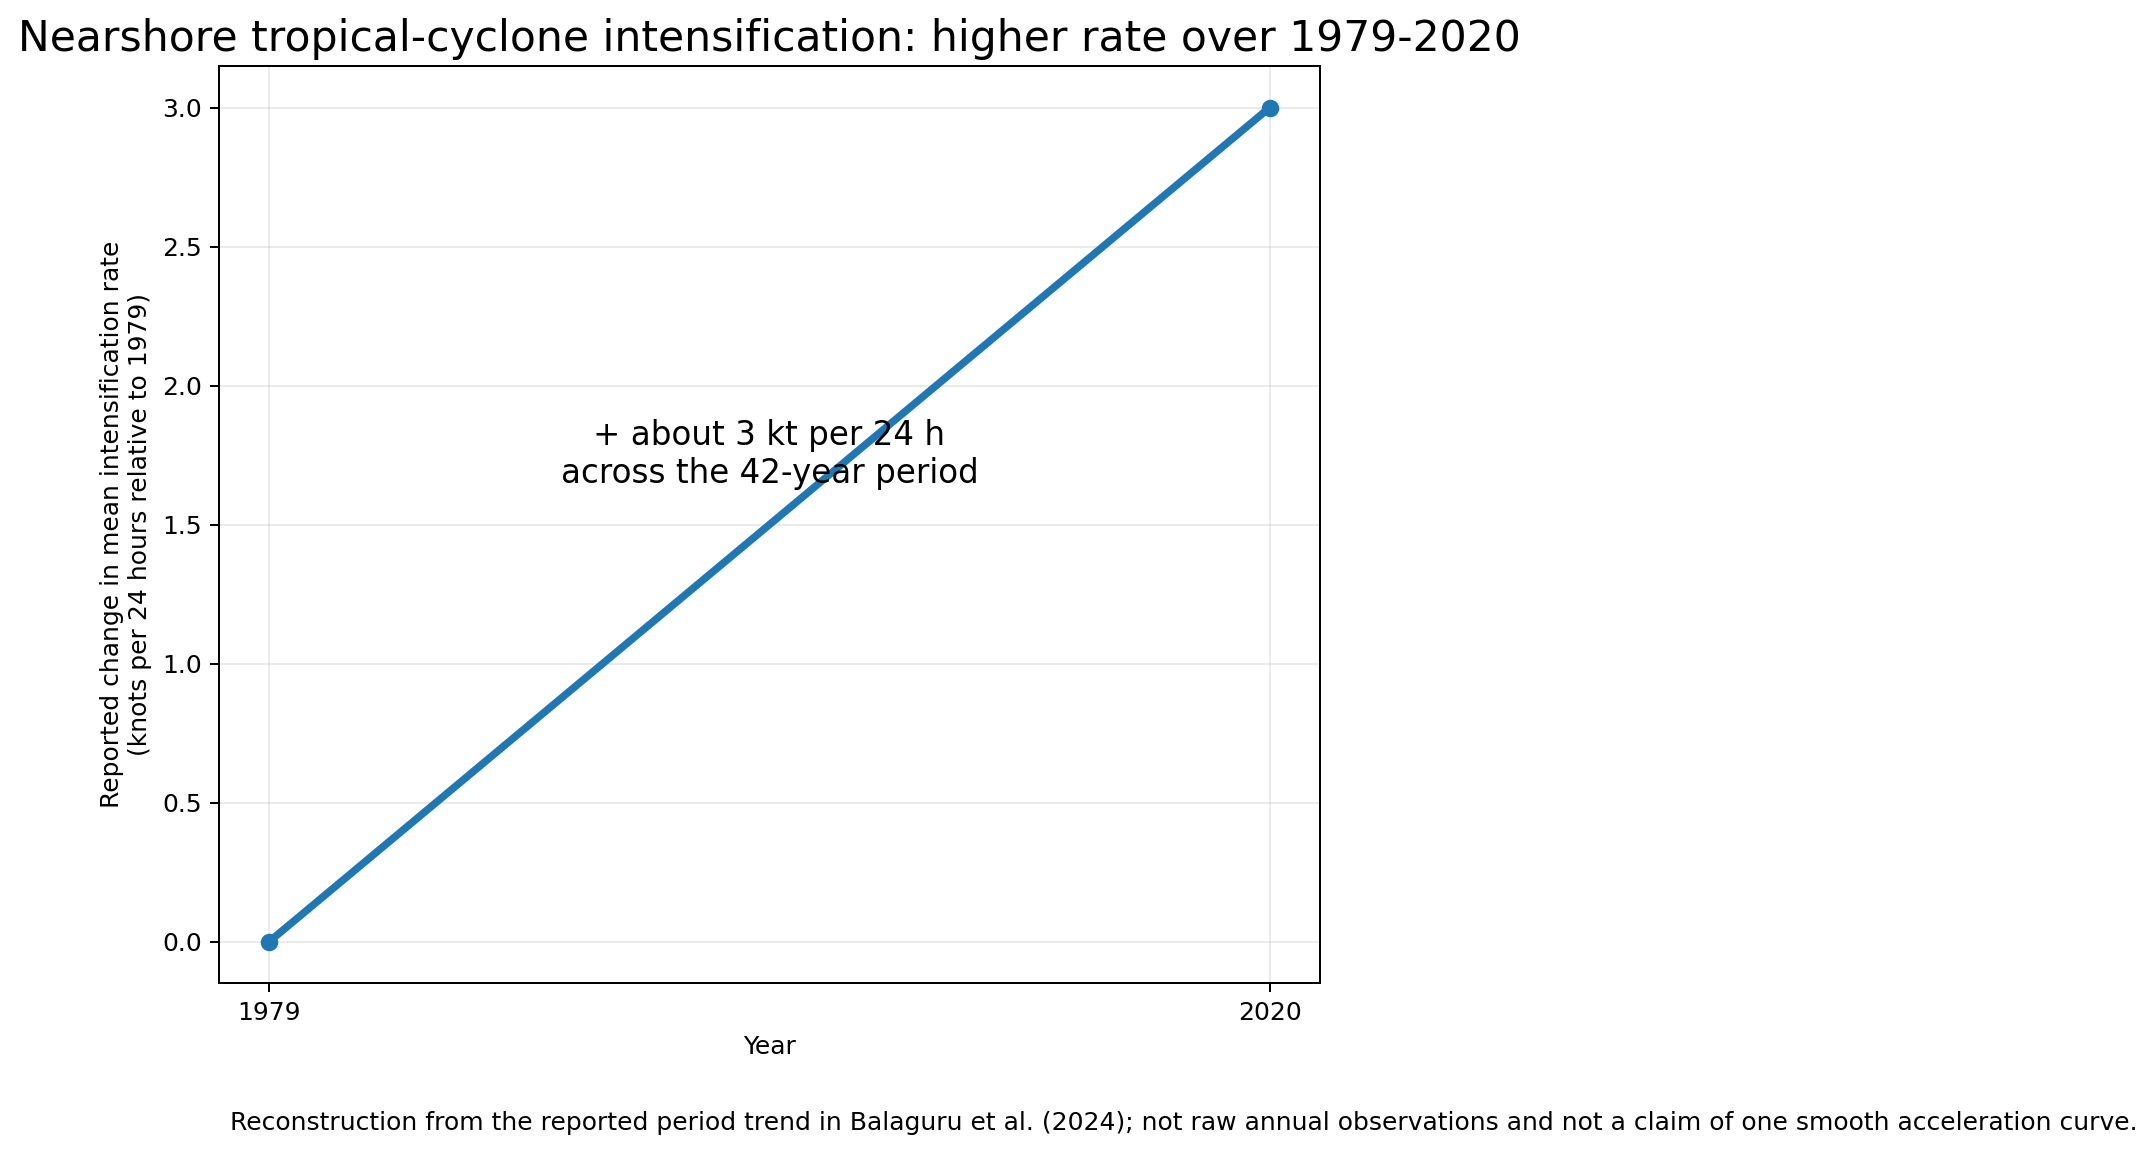
Fig. 22. Higher nearshore tropical-cyclone intensification rate Sources: [S25] The graphic shows the reported net increase of about 3 knots per 24 hours across 1979-2020; it is a reconstruction of the reported trend, not raw annual observations and not proof of one smooth acceleration curve.
Nearshore intensification matters because it reduces preparation time before landfall. Warmer water, greater ocean heat content, and atmospheric moisture can increase storm rainfall and support higher peak intensity, while wind shear and circulation can suppress development. That is why storm count, storm strength, rainfall, and intensification must be discussed separately. [S24, S25, S38]
6.4 Planetary waves and the jet stream
A 2025 PNAS study reported that one class of quasi-resonant Northern Hemisphere summer planetary-wave events tripled in frequency over about fifty years. Such patterns can help produce persistent heat, drought, or rain in multiple regions. This is important emerging evidence, but it is not proof that the entire jet stream has become uniformly slower or wavier in all seasons. [S26]
6.5 AMOC weakening is observed; accelerating collapse is not established
Direct observations from the RAPID array indicate that the Atlantic Meridional Overturning Circulation weakened by about 1.0 Sverdrup per decade from 2004 to 2023. The direction is consistent with long-term model expectations, but the direct record is short and natural variability is large. The evidence supports concern and close monitoring. It does not support presenting an imminent collapse date as an observed fact. [S27, S38]
7. Wildfire, Smoke, and Dust
7.1 Extreme wildfire events increased, with a metric dispute
A global satellite study found that the frequency of the most extreme energetic wildfire events increased about 2.2-fold from 2003 to 2023, and six of the seven most extreme years occurred in the last seven years. That is strong evidence that the upper tail of wildfire behavior worsened. [S28]
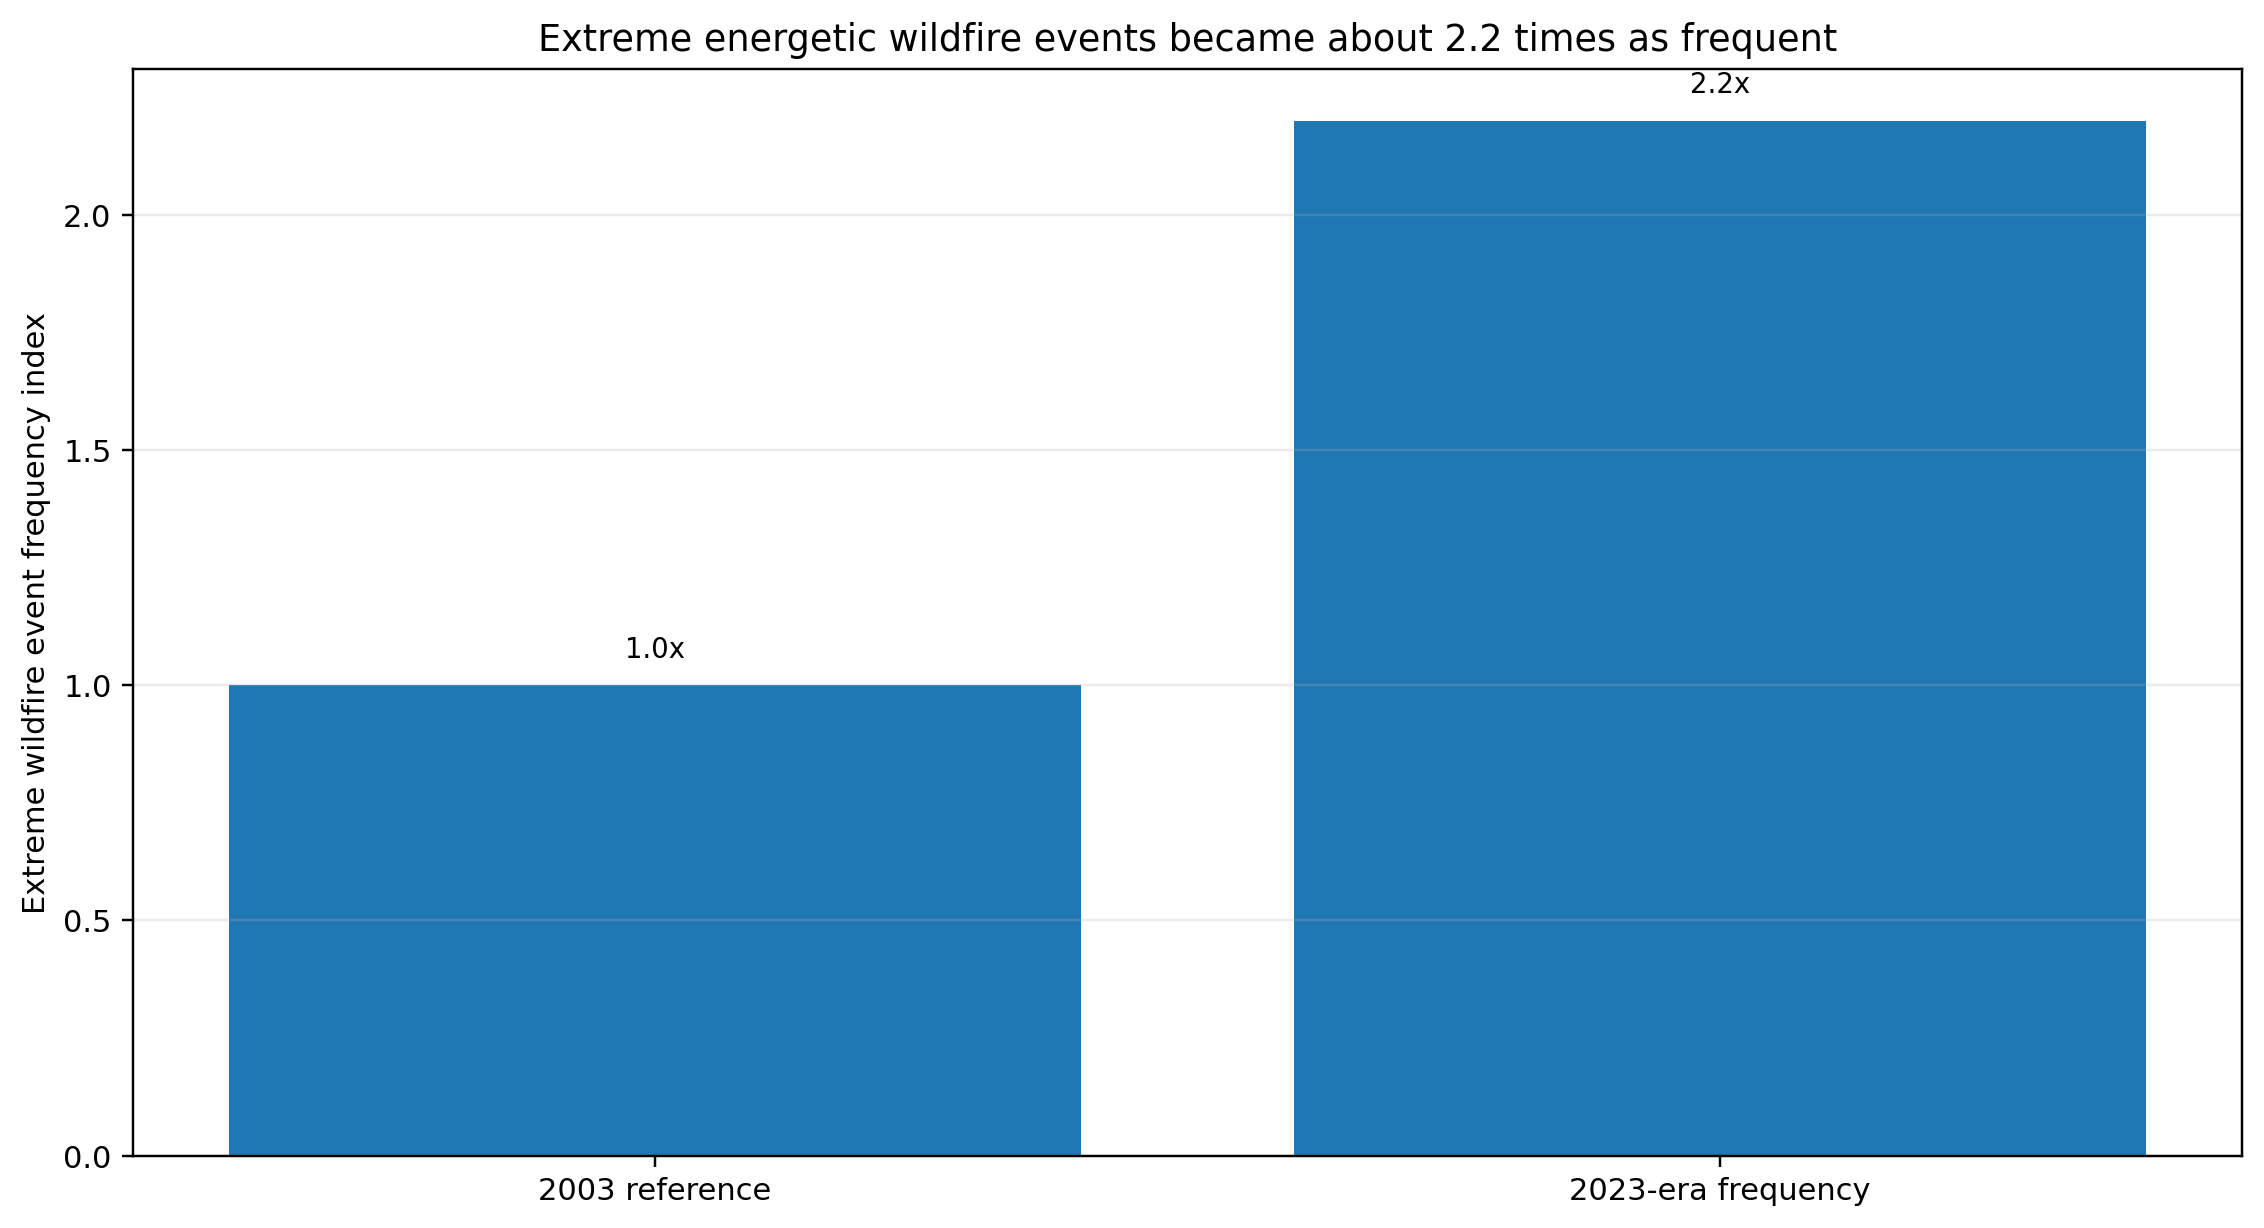
Fig. 23. Extreme wildfire event frequency index Sources: [S28, S29] The interpretation of the satellite event metric is debated; total global burned area can move differently.
A published critique argued that the event metric can rise because fires become larger or more simultaneous, not necessarily because local fireline intensity rises by the same amount. The original authors defended the event-based interpretation. Meanwhile, total global burned area can decline because agricultural expansion and fire suppression reduce routine burning in savannas. The correct synthesis is that extreme fire-event clusters have increased, while different fire metrics can move in different directions. [S28, S29]
7.2 Smoke turns regional fires into continental health events
The Lancet Countdown estimated about 154,000 deaths from wildfire-smoke PM2.5 exposure in 2024. Smoke can travel thousands of kilometers, so the health footprint can expand much farther than the burned area. Fire weather, vegetation, ignition, land management, and population exposure all contribute. The health burden is therefore an accelerating consequence in some regions, not a single pure climate variable. [S33, S34]
7.3 Dust storms: serious regional acceleration, mixed global trend
The user-visible reality of dust can worsen even when the global annual average does not rise smoothly. Across much of the U.S. Great Plains, dust aerosol optical depth increased about 3-5 percent per year from 2000 to 2018. The study identified rapid agricultural expansion as the main driver. Drought, bare soil, high winds, and warming can amplify emissions. [S30]
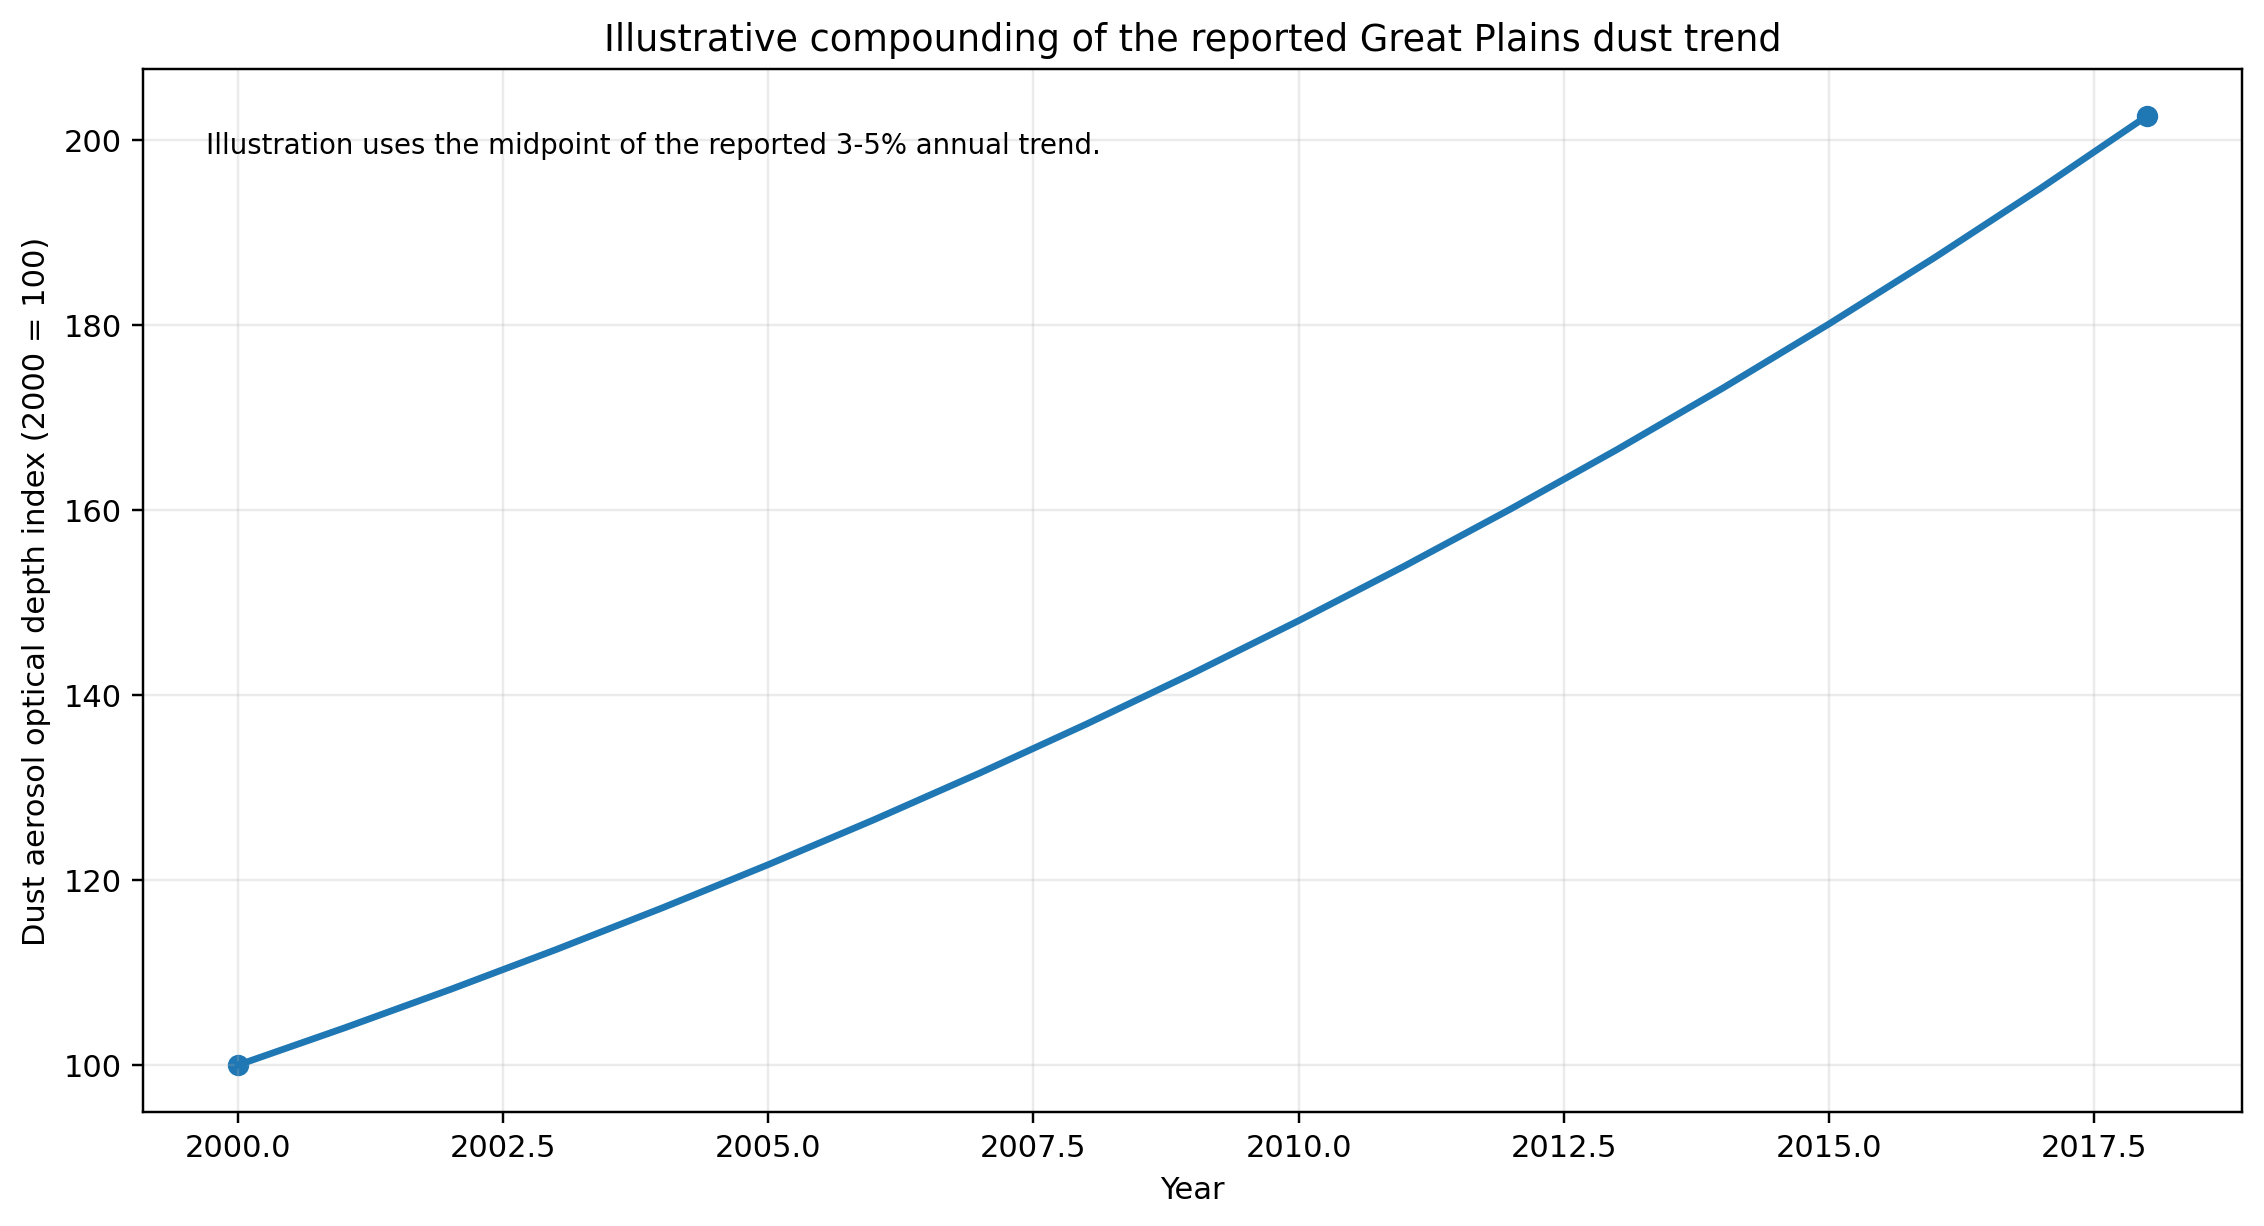
Fig. 24. Illustrative Great Plains dust trend Sources: [S30] Not raw annual observations. Agriculture was the main identified driver; drought and wind can amplify dust.
In China, total dust-storm frequency declined, but the share of severe and extreme events increased significantly since the early 2000s. WMO's global assessment identifies major hot spots and rising health and economic burdens, while also reporting that the 2024 global average was slightly below 2023. The defensible conclusion is regional severity acceleration and expanding consequences, not a universal global exponential dust curve. [S31, S32]
8. Carbon Sinks, Permafrost, and Ecosystem Feedbacks
8.1 Permafrost warming and a carbon-balance shift
At long-term Alaska monitoring sites, cold permafrost warmed about 0.3-0.7 degrees C per decade over four decades. In 2024, nine of twenty sites recorded their highest temperatures. When wildfire emissions are included, the Arctic tundra region has shifted from a long-term carbon dioxide sink to a source and remains a methane source. [S36]
This is a threshold-like state change rather than proof that all permafrost carbon emissions are accelerating everywhere. Vegetation growth can absorb carbon in some places while thaw, erosion, fire, and wetland methane release add it elsewhere. The risk lies in the direction of feedback: warming can weaken natural storage and add more greenhouse gases, which then add more warming. [S36, S38]
8.2 Carbon sinks are not guaranteed to scale with emissions
Land and ocean sinks currently remove a large share of human carbon dioxide emissions, but their yearly strength changes with heat, drought, fire, nutrient limits, circulation, and ocean chemistry. Concern is growing that warming and extreme events can weaken sink efficiency. The evidence is not a simple global monotonic collapse, because some years recover and some regions green. The system risk is that continued emissions rise while the fraction removed becomes less reliable. [S04, S07, S36, S38]
Emissions and sinks must be separated. The Global Carbon Budget 2025 reports that total anthropogenic CO2 emissions were nearly flat over 2015-2024 compared with faster growth in the previous decade, even though fossil CO2 emissions still reached a record 37.8 GtCO2 in 2024 and were projected to rise about 1.0 percent again in 2025. This means faster atmospheric CO2 growth cannot be interpreted simply as faster growth in total human emissions. [S48]
2023 provides an important sink-stress example, not proof of permanent collapse. A low-latency carbon-budget analysis estimated that the net land sink weakened sharply in 2023, with extreme heat, drought, and fire contributing to major regional carbon losses. That result helps explain why atmospheric CO2 growth can jump even when fossil-emission growth is modest. Because land sinks vary strongly with El Nino, drought, fire, and ecosystem conditions, one bad year should not be described as permanent sink failure; persistence across multiple cycles would be much stronger evidence. [S49]
8.3 Biodiversity loss interacts with climate acceleration
Climate change shifts temperature zones, seasons, fire regimes, water availability, ocean chemistry, and habitat boundaries. At the same time, deforestation, pollution, invasive species, overharvest, and land conversion reduce ecological resilience. These pressures are not competing explanations. They interact. A damaged forest, wetland, reef, or soil system stores less carbon, buffers fewer extremes, and recovers more slowly. [S14, S18, S28, S38]
Systems interpretation
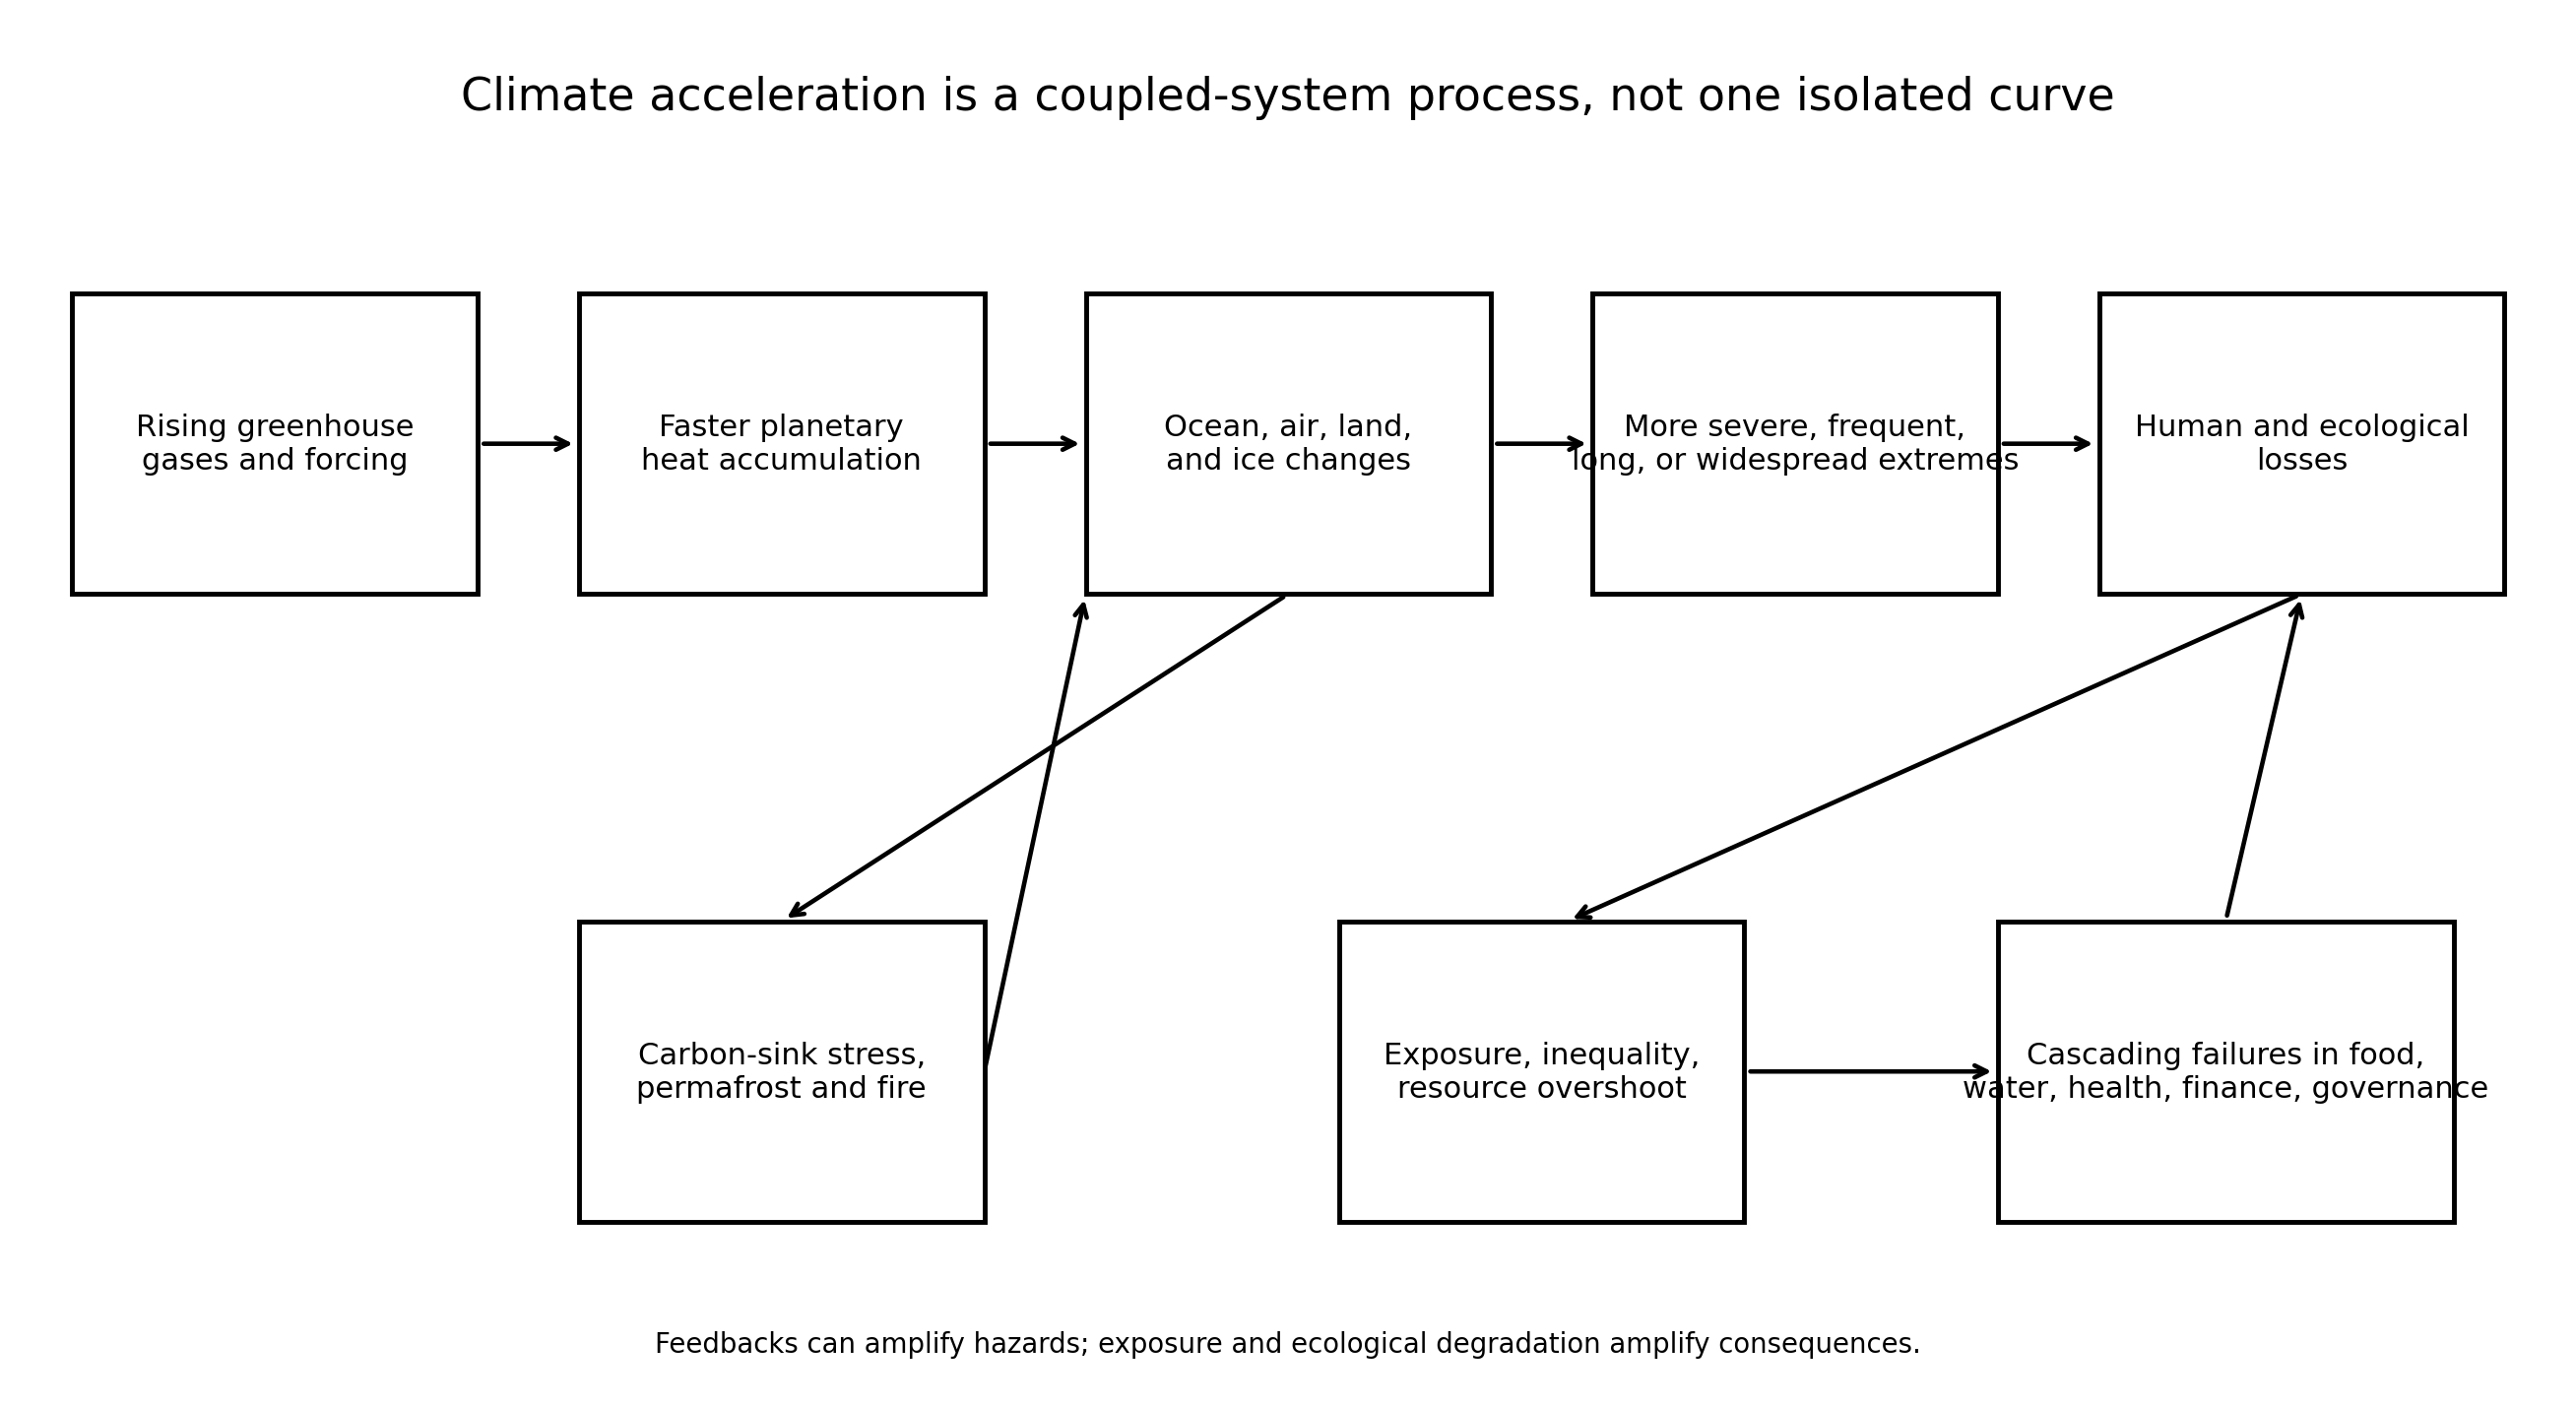
Climate acceleration cannot be understood as a row of independent gauges. It is a network of processes, relationships, feedbacks, thresholds, and changing contexts.
Environmental destruction and resource overshoot amplify climate consequences by reducing spare water, healthy soil, ecosystem buffering, public capacity, and household resilience. Climate then accelerates the degradation. That loop is often more socially dangerous than any single indicator.
9. Human Consequences Are Accelerating Too
Physical acceleration matters because people live inside food, water, health, housing, infrastructure, labor, insurance, migration, and governance systems. Those systems have thresholds and unequal buffers. A one-degree physical change does not create one unit of harm. It can push a power grid, crop, body, insurer, reservoir, or emergency service from strained to failed. [S01, S33, S35, S38]
9.1 Heat mortality and health-system pressure
The Lancet Countdown estimated that global heat-related mortality averaged about 546,000 deaths per year in 2012-2021, 63.2 percent above the estimated 335,000 annual average in 1990-1999. A separate age-standardized mortality-rate indicator is reported as 23 percent higher than in the 1990s; these are different measures and should not be conflated. Infants and adults over 65 experienced more than twenty heatwave days per person in 2024, roughly four times the exposure two decades earlier. These are modeled population-health indicators, and adaptation can reduce risk, but the direction is unambiguous. [S33, S34]
9.2 Work capacity and household economics
Heat exposure was estimated to eliminate 640 billion potential labor hours in 2024, 98 percent more than the 1990-1999 average, with an estimated income impact above one trillion U.S. dollars. Outdoor workers, low-income households, and people without reliable cooling carry a disproportionate burden. [S33, S34]
9.3 Infectious disease and smoke
Climate-defined dengue transmission potential increased 48.5 percent for Aedes albopictus and 17.0 percent for Aedes aegypti from 1951-1960 to 2015-2024. The smoke burden from extreme fires adds respiratory and cardiovascular harm far from the flames. Actual disease and death depend on public health, housing, mosquito control, immunity, pollution, and access to care, but climate increasingly loads the dice. [S33, S34]
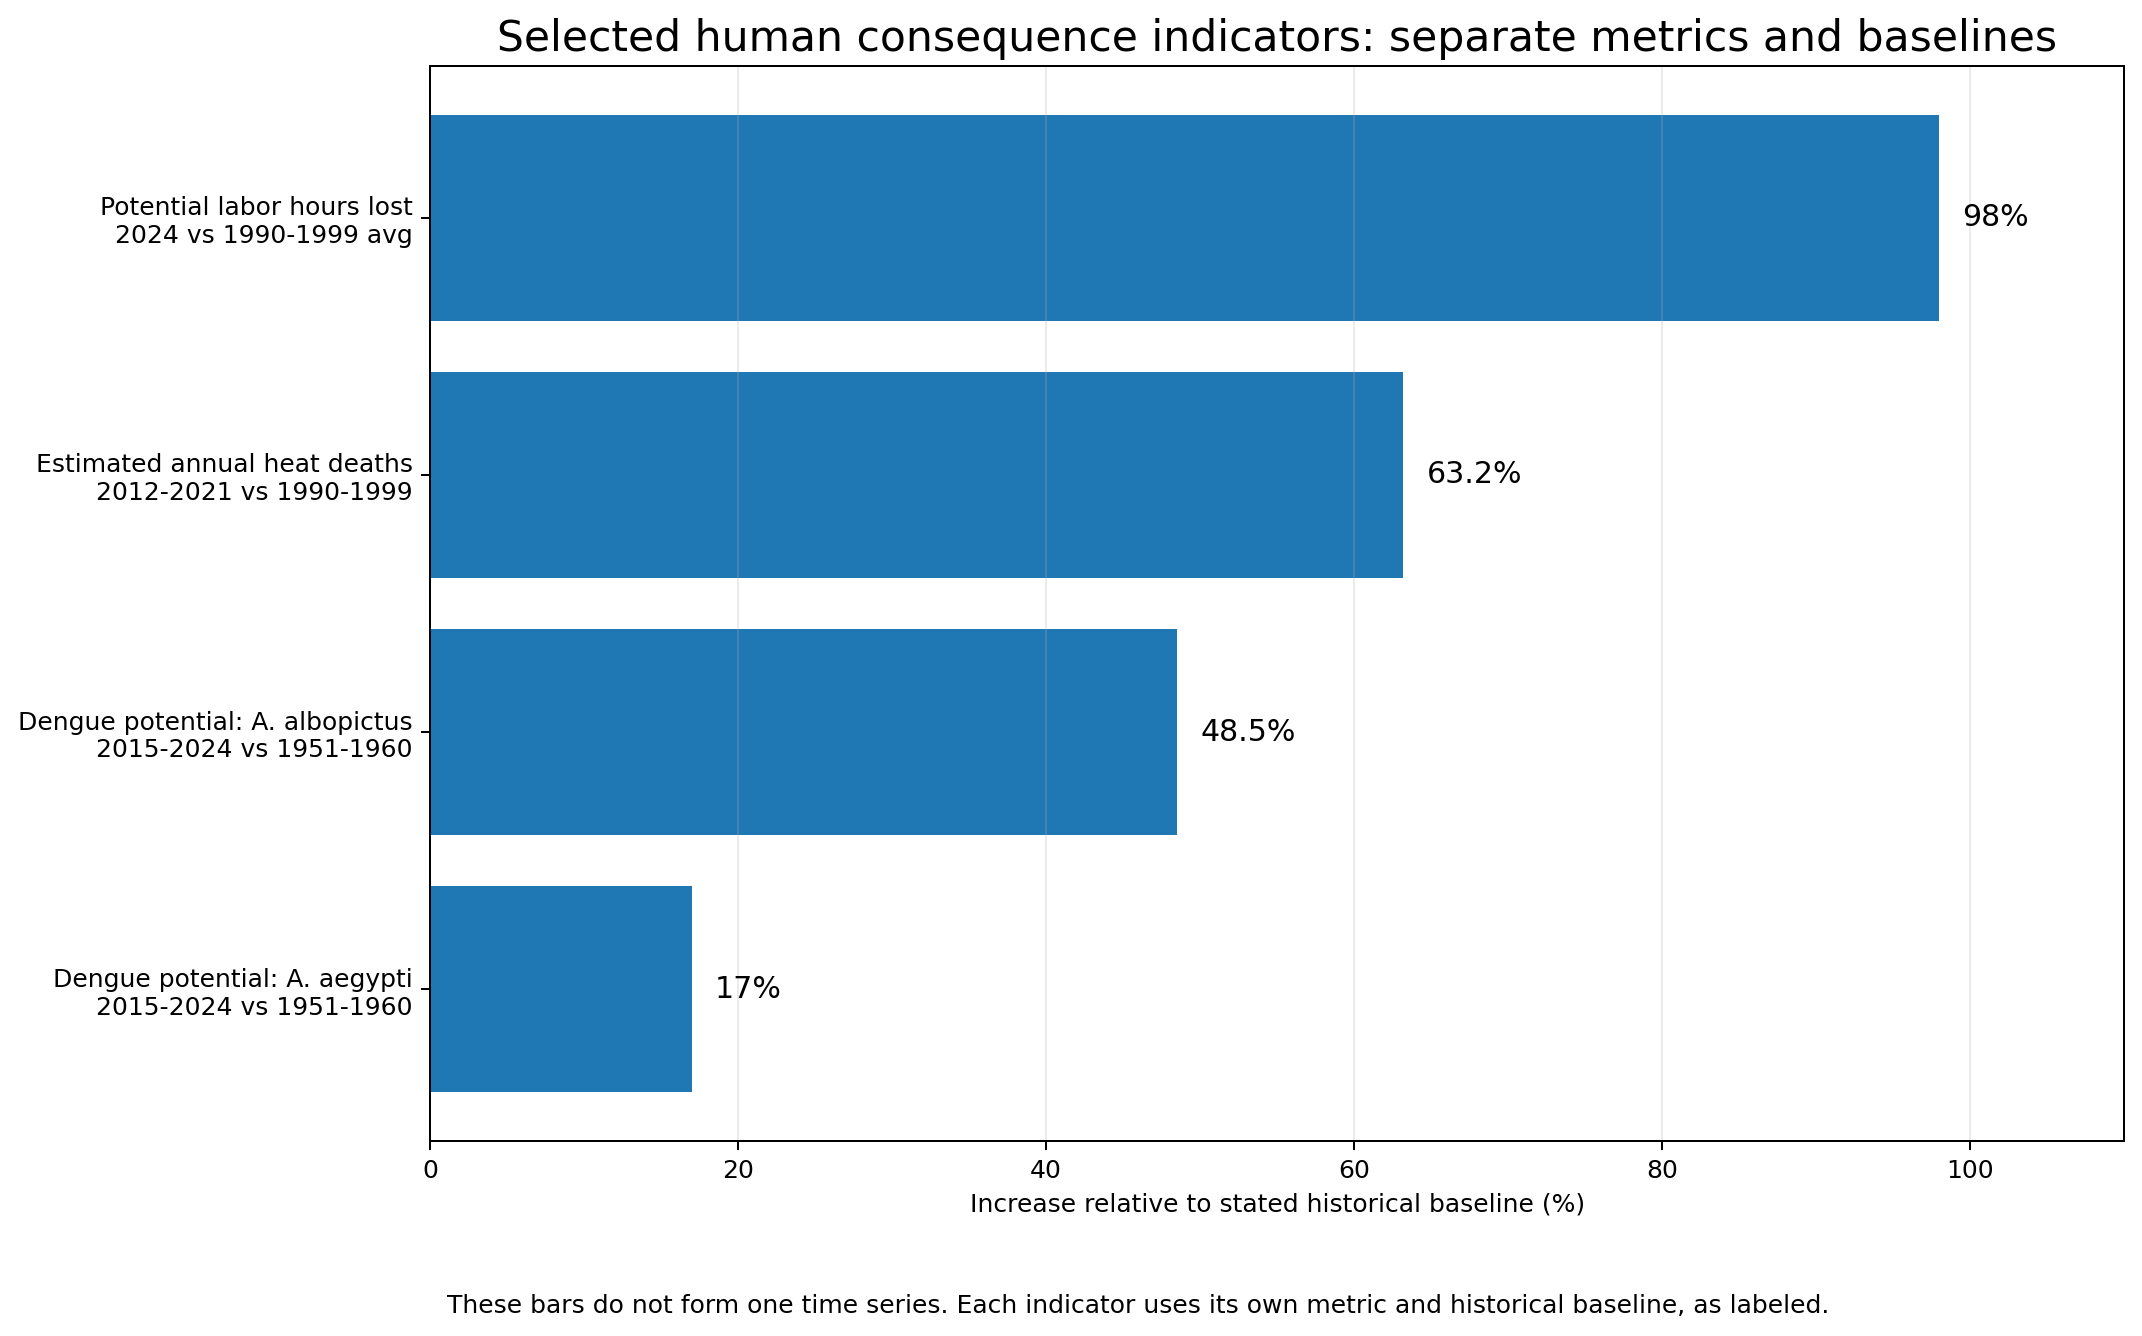
Fig. 25. Selected human consequence indicators with separate baselines Sources: [S33, S34] Baselines and methods differ. Heat deaths are shown as the percent increase in estimated annual deaths (63.2%), labor hours as the 2024 increase over the 1990-1999 average (98%), and dengue separately for two mosquito vectors (48.5% and 17.0%).
9.4 Food, water, migration, and conflict cascades
Drought and heat were associated with an additional 124 million people facing moderate or severe food insecurity in 2023. Crop losses, livestock heat, fisheries disruption, water scarcity, transport failures, and price shocks can combine. Climate rarely acts alone. It multiplies existing poverty, conflict, debt, inequality, ecological degradation, and weak governance. [S20, S33, S38]
Migration and political instability are therefore consequence pathways, not automatic one-step outcomes. A drought does not mechanically produce conflict. It changes resources, prices, livelihoods, and trust inside institutions. Whether the result is adaptation, migration, repression, cooperation, or violence depends on governance and social conditions. [S01, S38]
9.5 Insurance losses are compounding, but attribution is shared
Swiss Re estimates that inflation-adjusted insured natural-catastrophe losses have grown about 5-7 percent per year over the long run. Climate change contributes through changing hazards, especially heat, heavy rain, wildfire conditions, and coastal flooding. Yet rising exposure, more valuable property, construction costs, and insurance penetration are also major drivers. The loss curve is a warning about social vulnerability, not a laboratory thermometer. [S35]
10. Is Climate Change Becoming Exponential?
Some climate communication uses exponential as a synonym for very fast. That is mathematically sloppy and strategically fragile. An exponential process grows by a roughly constant percentage over equal time intervals. Many climate records are curved, noisy, piecewise, or threshold-driven rather than clean exponentials.
10.1 Where exponential-like or compounding behavior is plausible
- Threshold exceedance: as the mean temperature or sea level approaches a fixed danger threshold, the number of exceedance days can rise much faster than the mean.
- Long-duration heatwaves: probability and duration can increase nonlinearly with each added increment of warming. [S11]
- High-tide flooding: a few centimeters of sea-level rise can create several times more flood days after local thresholds are crossed. [S23]
- Regional dust or loss trends: a reported percentage increase per year can compound, although the driver may include land use, exposure, or costs rather than climate alone. [S30, S35]
- Feedback loops: ice-albedo loss, carbon-sink weakening, permafrost thaw, and fire can amplify the original forcing, although their combined trajectory is not one simple exponential.
10.2 Why consequences can accelerate faster than temperature
Global average temperature is close to proportional to cumulative carbon dioxide emissions over policy-relevant ranges. Many consequences are not. They depend on tails of probability distributions, local thresholds, interacting hazards, and vulnerable systems. A hospital can absorb ten hot days and fail on the eleventh. A reservoir can decline gradually and then impose rationing. An insurer can tolerate repeated losses until capital, reinsurance, or pricing fails. [S07, S23, S33, S35, S38]
Buffers and delays can hide change before revealing it. Ocean heat uptake is a major example: storing heat below the surface moderates atmospheric warming for a time, while changes in mixing and circulation can alter the timing of when heat affects the surface. Similar delays occur in ice sheets, groundwater, ecosystems, infrastructure, and insurance systems. A system can therefore look stable until a buffer weakens or a threshold is crossed.
Some climate systems also show hysteresis. In a hysteretic system, reversing the forcing does not necessarily restore the previous state along the same path or on the same timescale. Ice sheets, some ecosystems, and possible circulation regimes can exhibit this behavior. The existence and location of such thresholds are system-specific and uncertain; the paper does not assume that every climate subsystem is irreversible. [S38]
This creates an acceleration gap: physical warming may increase at one rate while disruption increases much faster. The gap widens when ecosystems are degraded, infrastructure is old, inequality is high, resources are overdrawn, or governance is captured and slow. The planet does not need every variable to become exponential for the lived crisis to feel exponential.
10.3 The most defensible public wording
Recommended statement
Climate change is accelerating in several core physical indicators, including planetary heat accumulation, ocean warming, sea-level rise, ice loss, and parts of the water cycle. Many other consequences are intensifying, expanding, or becoming more frequent, often through nonlinear thresholds and compounding interactions. Not every indicator is accelerating everywhere, and only some patterns are appropriately described as exponential-like.
11. Counterevidence, Limits, and Red-Team Findings
11.1 Indicators that should not be oversold
Claims requiring explicit qualification
| Indicator | Best-supported conclusion | Sources |
|---|---|---|
| Adjusted recent global warming rate | Foster and Rahmstorf find statistically significant acceleration after removing ENSO, volcanic-aerosol, and solar effects, but the raw series are less decisive. Mechanism attribution, short-record statistical power, and internal variability remain active questions. This paper therefore treats the result as A2 rather than A1. | S08; S44; S45; S46; S47 |
| Global tropical cyclone count | No robust observed global increase established. Discuss rapid intensification, rainfall, peak intensity, and regional changes separately. | S24 |
| Global river flooding | No uniform global acceleration across all rivers. Exposure and local watershed change strongly affect losses. | S38 |
| AMOC | Observed weakening over a short direct record, but acceleration and collapse timing are not established. | S27 |
| Arctic minimum sea-ice extent | Strong long-run decline and structural thinning, but no significant trend over roughly the latest two decades in minimum extent. | S17;S18 |
| Wildfire | Extreme event clusters increased, while total global burned area and local fireline intensity can show different patterns. | S28;S29 |
| Dust | Regional severity and exposure worsened, but global annual dust is not a smooth upward series. | S30;S31;S32 |
| Groundwater | Many aquifers accelerate downward, but pumping, policy, and recovery projects are central drivers. | S22 |
| Insured losses | The trend is real but shared among hazard, exposure, wealth, costs, and insurance coverage. | S35 |
11.2 Common reasoning errors
- Confusing a record high with acceleration. A level can be highest ever without its rate increasing.
- Fitting an exponential to a short noisy interval and presenting it as a physical law.
- Using one region as proof of a global trend.
- Treating a consequence with many drivers as a pure climate signal.
- Averaging away extremes. A stable global average can hide severe regional acceleration.
- Treating mixed evidence as no risk. Uncertainty can include worse outcomes, not only milder ones.
- Treating natural variability and human forcing as alternatives. Natural variability acts on top of the long-term forced trend.
- Assuming adaptation cancels acceleration. Adaptation can reduce harm, but it has costs, limits, unequal access, and possible failure thresholds.
11.3 What evidence would change the conclusion?
The central conclusion would weaken if independent observing systems showed that recent increases in Earth energy imbalance, ocean heat uptake, sea-level rate, ice loss, marine heatwaves, and atmospheric forcing were artifacts of shared methods or temporary variability and then reversed for long enough to alter multi-decade trends. It would also weaken if new assessments found that the apparent rate changes disappeared under robust baseline and endpoint tests.
For the adjusted warming result specifically, the conclusion would weaken if longer unadjusted records fail to show a higher rate, if large-ensemble analyses show the apparent break is readily produced by internal variability, or if the recent temperature surge proves predominantly transient. It would strengthen if longer records, independent attribution methods, and physically resolved forcing changes converge on the same higher rate. [S44, S45, S46, S47]
The conclusion would strengthen if longer records confirm recent temperature acceleration without adjustment, if carbon-sink efficiency declines persistently, if regional dust and fire severity trends broaden, or if direct observations show accelerating changes in circulation, permafrost emissions, or deoxygenation. The research package is designed so those updates can be added without rewriting the logic from scratch.
11.4 Dyslexia and consistency audit
Names, dates, units, time windows, and baselines were checked for consistency. The paper uses ppm for carbon dioxide, ppb for methane and nitrous oxide, W/m2 for energy imbalance or forcing, zettajoules for heat, millimeters per year for sea-level rate, and gigatons per year for ice loss. Comparison periods are written beside each number because a number without its comparison window can be misleading.
12. Conclusion
The evidence supports a strong, carefully bounded conclusion: multiple fundamental components of the climate system are changing at faster rates, while many consequences are worsening through higher rates, nonlinear thresholds, broader spatial reach, longer duration, or compounding exposure. The clearest demonstrated or strongly supported rate-change signals include adjusted global warming, Earth energy imbalance, sea-level rise, atmospheric carbon dioxide growth, ocean heat uptake, marine heatwaves, land-ice loss, and threshold coastal flooding. Hydroclimate whiplash, nearshore storm intensification, drought, wildfire, dust, and human consequences are treated separately according to the strength and type of evidence. [S03, S04, S07, S08, S15, S16, S19, S23, S25]
The strongest argument is cumulative. Atmospheric observations, ocean measurements, satellites, tide gauges, glacier inventories, health models, and regional event records are independent lines of evidence. They do not all bend at the same time or by the same mechanism. Yet together they show a climate system receiving more energy and transmitting that energy through water, ice, ecosystems, extremes, and human institutions. [S03, S07, S38]
The correct response is not to replace gradualism with indiscriminate apocalypse language. It is to update risk management for a nonstationary world. Plans based on twentieth-century rates, historical return periods, stable coastlines, reliable snowpack, old heat thresholds, or unlimited insurance capacity are increasingly obsolete. The physics is accelerating in important places. The consequences can accelerate faster. Waiting for every subsystem to display a perfect exponential curve would be a threshold response that can become obvious only after impacts rise sharply.
Frequently Asked Questions
1. Is global warming definitely accelerating?
The newest annual assessment finds a record-high human-induced warming rate of about 0.27 degrees C per decade for 2016-2025. A separate analysis detects statistically significant acceleration only after adjustment for ENSO, volcanic aerosols, and solar variability; the raw records are less decisive. The safest conclusion is that the recent underlying warming rate is high and likely higher than earlier decades, while the exact onset, persistence, and mechanisms of acceleration remain under investigation. [S07, S08, S44]
2. Does one hot year prove acceleration?
No. One record year shows a high level, not a change in the long-term rate. Acceleration requires comparing rates, testing trends, or showing nonlinear response across a longer record.
3. What is the strongest single acceleration indicator?
Earth energy imbalance is one of the strongest integrative acceleration indicators because it measures the rate at which the whole planet gains heat. It has more than doubled in recent decades and is supported by ocean and satellite observations. The recent increase does not have one settled cause; greenhouse forcing, aerosol changes, cloud/albedo changes, and internal variability can all contribute. [S03, S07, S45, S46, S47]
4. Why is ocean heat more important than air temperature?
The ocean stores about 90 percent of the excess heat. Surface air temperature can jump around as heat moves between ocean and atmosphere, while ocean heat content better tracks the accumulated energy in the system. [S03, S07]
5. Is climate change exponential?
Not as one universal curve. Some processes are approximately linear, some accelerate, some respond nonlinearly to warming, some cross thresholds, and some can compound at percentage rates. Use exponential only for a defined variable, interval, and fitted pattern.
6. Which observed changes are closest to direct acceleration?
The clearest examples in this review are adjusted global warming, Earth energy imbalance, sea-level rise, CO2 growth rate, ocean heat uptake, marine heatwaves, glacier loss, combined ice-sheet loss, and threshold high-tide flooding. Hydroclimate whiplash and nearshore cyclone intensification are important, but are classified as nonlinear response or higher recent rate rather than strict demonstrated temporal acceleration. [S03, S04, S15, S16, S19, S25]
7. Are hurricanes becoming more common?
A robust increase in total global tropical cyclone count has not been established. Evidence is stronger for rising rainfall, higher peak intensity in a warmer world, more rapid intensification in some records, and faster nearshore intensification. [S24, S25]
8. Are floods increasing everywhere?
No. Heavy rainfall and coastal flooding are worsening in many places, but river-flood trends vary by basin and are affected by land use, dams, soil moisture, drainage, and exposure. [S23, S38]
9. Is drought increasing even where rainfall rises?
It can. Higher temperature raises evaporation and atmospheric water demand. A region can receive more annual rain yet experience longer dry spells, more intense downpours, or greater soil-moisture loss between storms. [S19]
10. Why can coastal flooding accelerate faster than sea level?
Flooding begins after water crosses a local threshold. As mean sea level approaches that threshold, small additional rises can create many more flood days. [S23]
11. Is Arctic sea ice still declining?
Yes over the full satellite record, and the ice is much younger and thinner. However, minimum extent has not shown a statistically significant trend over roughly the last two decades. Both facts should be stated. [S17, S18, S40]
12. Are wildfires increasing globally?
The most extreme energetic wildfire events increased strongly in the satellite record, but total global burned area can decline and the interpretation of intensity metrics is debated. Extreme-fire risk and burned area are different measures. [S28, S29]
13. Are dust storms caused by climate change?
Dust has multiple drivers: drought, wind, land degradation, agriculture, grazing, fire, and soil disturbance. Climate can increase aridity and drought in some regions, but regional land management can dominate. [S30, S31, S32]
14. Does natural variability explain the recent changes?
Natural variability affects individual years and regions. It does not explain the long-term rise in greenhouse gases or the full multi-system pattern. Statistical adjustment can help isolate the forced warming signal. [S07, S08, S38]
15. Can adaptation stop the consequences?
Adaptation can reduce harm substantially, especially through heat plans, water management, early warning, building standards, ecosystem protection, and public health. It cannot remove all risk, and its limits tighten as warming and exposure rise.
16. Why include insurance and labor losses if they are not pure climate measures?
They show how physical change enters human systems. They are included with explicit attribution caveats because exposure, wealth, costs, and policy also shape the curves. [S33, S35]
17. What does a Grade C finding mean?
It means the finding is important but regional, emerging, multi-driver, or method-sensitive. It should inform risk management without being presented as a universal global acceleration law.
18. Is this paper saying collapse is certain?
No. It says risk is rising faster in important systems and that plans based on historical stationarity are unsafe. Outcomes still depend heavily on emissions, adaptation, ecological protection, governance, technology, cooperation, and whether institutions suppress free-riding and capture.
19. Why organize the paper with Job One categories?
The Job One lists are broad and consequence-oriented, so they prevent a temperature-only analysis. The scientific claims are independently sourced because an organizing framework and an evidence authority are different things. [S01, S02]
20. What should readers remember?
The most accurate one-sentence summary is: several core climate indicators are accelerating, many other impacts are intensifying or expanding, and nonlinear thresholds can make human consequences accelerate faster than global average temperature.
Glossary
Aerosol: A tiny solid or liquid particle suspended in the atmosphere. Many sulfate aerosols reflect sunlight and increase cloud brightness, producing a cooling effect that can partly mask greenhouse-gas warming.
Hysteresis: Behavior in which a system does not return along the same path when a forcing is reversed. After some thresholds, restoring earlier conditions may require a much larger reversal or may take a very long time.
Internal variability: Natural climate fluctuations generated within the ocean-atmosphere system, such as El Nino and La Nina, that can temporarily speed or slow surface warming.
Planetary albedo: The fraction of incoming sunlight reflected back to space by clouds, aerosols, ice, snow, land, and the ocean. Lower albedo means more solar energy is absorbed.
Radiative forcing: A change in Earth's energy balance, usually expressed in watts per square meter, caused by factors such as greenhouse gases, aerosols, solar changes, or land-surface changes.
Carbon-sink efficiency: The effectiveness with which land or ocean processes remove carbon dioxide from the atmosphere relative to the amount available to absorb.
Acceleration: An increase in the rate of change. If sea level rises faster in a later period than an earlier one, the rise has accelerated.
Adaptation: Actions that reduce harm from climate impacts, such as cooling centers, flood protection, drought planning, or heat-resistant infrastructure.
Aerosol: A tiny particle or droplet in the atmosphere. Some aerosols cool climate by reflecting sunlight; dark particles can warm air or reduce snow reflectivity.
Albedo: The fraction of incoming sunlight reflected by a surface. Snow and ice have high albedo; dark ocean and land absorb more heat.
AMOC: Atlantic Meridional Overturning Circulation, a large system of Atlantic Ocean currents that transports heat, salt, carbon, and nutrients.
Anomaly: A difference from a selected reference-period average.
Anthropogenic: Caused by human activity.
Aquifer: A body of rock or sediment that stores and transmits groundwater.
Arctic amplification: The faster warming of the Arctic compared with the global average.
Aridity: Long-term dryness caused by low precipitation relative to atmospheric water demand.
Attribution: The process of estimating how much an observed change or event was influenced by a cause such as greenhouse gases.
Baseline: A reference period or value used for comparison.
Biodiversity: The variety of genes, species, and ecosystems.
Carbon budget: The total amount of carbon dioxide that can be emitted while retaining a stated chance of staying below a warming limit.
Carbon sink: A system that absorbs more carbon than it releases, such as an ocean, forest, or soil during a given period.
Carbon source: A system that releases more carbon than it absorbs.
Climate: The long-term statistical pattern of weather, usually described over decades or longer.
Climate feedback: A process that amplifies or reduces an initial climate change.
Climate forcing: A change in Earths energy balance caused by greenhouse gases, aerosols, solar changes, volcanoes, or other factors.
Climate system: The interacting atmosphere, ocean, ice, land, water cycle, living systems, and energy flows that shape climate.
Compounding: Growth in which changes build on earlier changes, or several hazards act together.
Confidence interval: A range used to express uncertainty around an estimate.
Consequence capture: A governance principle in which decision-makers and actors experience enough of the consequences of their decisions to align incentives with the common good.
Cryosphere: All frozen parts of Earth, including glaciers, ice sheets, sea ice, snow, and permafrost.
Desertification: Land degradation in dry regions caused by climate variation and human activity.
Drought: An extended shortage of water relative to normal conditions or needs. It can be meteorological, agricultural, hydrological, or ecological.
Earth energy imbalance: The difference between energy Earth absorbs and energy it emits to space. A positive imbalance means the planet is gaining heat.
Ecological degradation: Loss of ecosystem health, function, resilience, or biological diversity.
El Nino: A recurring warming of the tropical Pacific Ocean that changes weather patterns and temporarily affects global temperature.
Evaporative demand: The atmospheres capacity to pull water from soil, plants, and water surfaces.
Exponential growth: Growth by a roughly constant percentage over equal intervals, causing the absolute increase to become larger over time.
Exposure: People, ecosystems, infrastructure, or assets located where a hazard can affect them.
Extreme event: An event near the rare end of the historical distribution, such as unusual heat, rain, drought, or wind.
Feedback loop: A chain in which an effect returns to influence its original cause.
Fire weather: Hot, dry, windy conditions that favor ignition and rapid fire spread.
Forcing: See climate forcing.
Gigaton: One billion metric tons.
Global mean sea level: The average height of the worlds ocean surface, adjusted and combined across regions.
Greenhouse gas: A gas that absorbs and re-emits infrared energy, slowing Earths loss of heat to space.
Groundwater: Water stored below ground in soil and rock.
Hazard: A physical event or trend that can cause harm.
Heatwave: A period of unusually hot weather relative to local conditions and definitions.
High-tide flooding: Coastal flooding caused when tides and elevated sea level cross local impact thresholds, sometimes without a storm.
Hydroclimate: The interaction of climate with precipitation, evaporation, rivers, soil moisture, snow, and water storage.
Hydroclimate whiplash: A rapid or large swing between unusually wet and dry conditions, or the reverse.
Ice sheet: A continent-scale mass of land ice, principally Greenland or Antarctica.
Internal variability: Natural fluctuations within the climate system, such as El Nino and ocean circulation changes.
Jet stream: A band of strong winds high in the atmosphere that helps steer weather systems.
Land subsidence: The sinking of land, often from groundwater withdrawal, sediment compaction, or geologic processes.
Linear change: Change that adds roughly the same absolute amount during each equal interval.
Marine heatwave: A prolonged period of unusually warm ocean temperature relative to a local seasonal baseline.
Methane: A powerful greenhouse gas emitted by fossil-fuel systems, agriculture, wetlands, waste, fires, and thawing environments.
Mitigation: Actions that reduce greenhouse gas emissions or increase durable removal of greenhouse gases.
Nonlinear: A relationship in which equal changes in one variable do not produce equal changes in another.
Nonstationarity: The condition in which historical averages, variability, or extremes no longer remain stable over time.
Ocean acidification: The decrease in ocean pH caused mainly by absorption of human-produced carbon dioxide.
Ocean deoxygenation: The loss of dissolved oxygen from ocean water.
Ocean heat content: The amount of thermal energy stored in the ocean.
Overshoot: Use of resources or production of pollution beyond the regenerative and absorptive capacity of ecological systems; also exceeding a climate target before possibly returning below it.
Parts per billion (ppb): A concentration unit equal to one part in one billion parts.
Parts per million (ppm): A concentration unit equal to one part in one million parts.
Permafrost: Ground that remains at or below freezing for at least two consecutive years.
pH: A scale of acidity and alkalinity. Lower pH is more acidic.
Planetary boundary: A proposed limit for a major Earth-system process beyond which the risk of destabilization rises.
PM2.5: Airborne particles 2.5 micrometers or smaller that can enter deep into lungs and the bloodstream.
Radiative forcing: The change in Earths energy balance measured in watts per square meter after a forcing agent changes.
Rapid intensification: A fast increase in tropical cyclone wind speed over a short period, commonly assessed over 24 hours.
Relative sea level: Sea level measured relative to the local land surface, including both ocean change and land motion.
Resilience: The capacity to withstand, adapt to, and recover from disturbance without losing essential function.
Return period: The average interval expected between events exceeding a defined magnitude under an assumed stable climate.
Risk: The combination of hazard, exposure, vulnerability, and consequences.
Sea ice: Frozen ocean water.
Severity: The magnitude or harmfulness of an event or condition.
Sink efficiency: The share of emissions absorbed by a carbon sink over a period.
Sverdrup: A unit of ocean flow equal to one million cubic meters per second.
Threshold: A point at which a small additional change produces a large shift in impact or system behavior.
Tipping element: A large Earth-system component that may shift into a different state after a critical threshold is crossed.
Trend: A long-term direction of change estimated from data.
Tropical cyclone: A rotating tropical storm system, called a hurricane or typhoon in some regions when sufficiently strong.
Uncertainty: A quantified or described limit on knowledge caused by measurement, variability, model structure, or incomplete evidence.
Vulnerability: The tendency of people, ecosystems, or systems to be harmed because of sensitivity and limited capacity to cope.
Water vapor: Water in gaseous form. It is the most abundant greenhouse gas and mainly acts as a feedback to warming.
Wet-bulb temperature: A measure combining heat and humidity that indicates evaporative cooling potential.
Zettajoule: One sextillion joules, written as 10 to the 21st power joules.
Appendix A. Job One Framework Mapping
The following map shows how the Job One consequence framework was used to organize the search. It is not a claim that Job One originated or independently validated the scientific findings. [S01, S02]
Job One categories mapped to reviewed evidence
| Job One category | Evidence reviewed | Matrix entries |
|---|---|---|
| 1. Greenhouse gases and baseline heat | CO2, methane, nitrous oxide, forcing, global temperature | E01-E06 |
| 2. Humidity and wet-bulb heat | Atmospheric water vapor, humid heat, heat mortality | E07-E09; E35 |
| 3. Hydrologic whiplash | Wet-dry volatility, heavy precipitation context | E19 |
| 4. Drought, desertification, water scarcity, dust | Drought severity, dryland expansion, groundwater, dust | E20-E22; E31-E33 |
| 5. Wind and storms | Cyclone count limits, nearshore intensification | E25-E26 |
| 6. Seasonal instability and jet stream | Planetary-wave resonance, circulation caveats | E27-E28 |
| 7. Wildfire and smoke | Extreme fire events, smoke mortality | E29-E30 |
| 8. Cryosphere | Glaciers, ice sheets, sea ice, snow | E15-E18 |
| 9. Albedo | Old sea ice, snow loss, amplifying feedback | E17-E18 |
| 10. Sea level and coasts | Sea-level acceleration, high-tide flooding | E12; E24 |
| 11. Ocean heat and chemistry | Ocean heat, marine heatwaves, acidification | E10-E14; E41 |
| 12. Coral, fisheries, biodiversity | Coral bleaching and ecosystem interaction | E14; supporting discussion |
| 13. Forests, sinks, permafrost, methane | Permafrost warming, tundra carbon shift, sink stress | E34 |
| 14. Ocean circulation | AMOC observed weakening with uncertainty | E28 |
| 15. Biodiversity and disease vectors | Dengue suitability, ecological interaction | E37 |
| 16. Human health | Heat mortality, smoke, labor, food security | E30; E35-E38 |
| Secondary consequences | Coastal infrastructure, work, food, water, health systems, insurance, finance, migration, governance | E24; E35-E39 plus systems discussion |
Appendix B. Full Evidence Matrix
Climate acceleration evidence matrix
| ID | Indicator | Observed finding | Grade and class | Scope | Key caveat | Sources |
|---|---|---|---|---|---|---|
| E01 | Atmospheric CO2 concentration and growth rate | Global annual mean CO2 reached 425.62 ppm in 2025. WMO reports that the decadal-average growth rate rose from about 0.8 ppm per year in the 1960s to about 2.4 ppm per year in 2011-2020. | A2 - Significantly higher recent rate | Global | Year-to-year growth varies with emissions, land and ocean sinks, fire, and ENSO. | S04;S05 |
| E02 | Methane and nitrous oxide | Methane and nitrous oxide reached unprecedented global concentrations in 2024; methane growth resumed after a near-plateau around 1999-2006. | B - Strong worsening trend | Global | Recent annual growth rates fluctuate and do not establish a single smooth acceleration curve. | S04;S37 |
| E03 | Long-lived greenhouse gas forcing | NOAA Annual Greenhouse Gas Index forcing increased 54 percent from 1990 to 2024; total anthropogenic effective radiative forcing reached about 3.10 W/m2 in 2025 relative to 1750. | B - Strong worsening trend | Global | Net forcing includes offsetting aerosol effects and year-to-year wildfire aerosol variability. | S04;S07 |
| E04 | Human-induced warming rate | Human-induced warming increased at 0.27 degrees C per decade over 2016-2025, while observed warming over the same rolling-decade calculation was about 0.30 degrees C per decade. | A2 - Record-high / higher recent warming rate | Global | A ten-year rate is sensitive to endpoints; attribution methods give a likely range of 0.2-0.4 degrees C per decade. | S07 |
| E05 | Statistically adjusted recent warming | After adjusting for ENSO, volcanic aerosols, and solar variability, five major temperature records yielded recent rates around 0.34-0.42 degrees C per decade and an acceleration signal above 98 percent confidence. | Higher recent rate after statistical adjustment | Global | Raw records are less decisive; mechanism attribution, internal variability, and short-record robustness remain active questions. | S08; S44; S45; S46; S47 |
| E06 | Rate of planetary heat accumulation | Earth energy imbalance has more than doubled in recent decades. Long-run ocean-based acceleration is about 0.13 W/m2 per decade since 1960, rising to about 0.30 W/m2 per decade for 2001-2025; satellite estimates are about 0.44 W/m2 per decade for the recent period. | A1 - Demonstrated temporal acceleration | Global | Different methods and time windows should not be treated as a single seamless series. | S03;S07 |
| E07 | Total precipitable water | Independent observing systems find rising atmospheric water vapor, with estimates near 1 percent per decade for 1988-2014 and about 2 percent per decade for 1993-2021. | B - Strong worsening trend | Global | The estimates use different datasets, windows, and methods and do not by themselves prove acceleration. | S09;S10 |
| E08 | Long-duration heatwaves | Long-duration heatwave risk rises nonlinearly with warming; each additional increment of warming increases characteristic duration more than the previous increment. | N - Nonlinear response with additional warming | Global analysis of observations and models | The result describes response to warming and projected continuation, not one universal annual time series for every region. | S11 |
| E09 | Extreme wet-bulb temperature | Extreme humid heat increased in most assessed land regions from 1979 to 2019; about half of the regions had statistically significant increases exceeding 0.5 degrees C. | B - Strong worsening trend | Global regional analysis | Magnitude varies by region, and at least one region showed a significant decrease. | S12 |
| E10 | Upper-ocean heat accumulation rate | The upper 2,000-meter ocean heat accumulation rate increased from about 3.05-3.91 ZJ per year in 1960-2005 to about 11.0-12.2 ZJ per year in 2005-2025. | A2 - Significantly higher recent heat-accumulation rate | Global | Dataset spread remains substantial, although all major products show the same direction. | S03 |
| E11 | Global mean marine heatwave days | Marine heatwave days more than tripled between 1991 and 2025. The average rose from 36 days in 2007-2016 to 58 days in 2016-2025, and reached 82 days in 2024. | A2 - Significantly higher recent occurrence/persistence | Global ocean, 60 S to 60 N | Strong El Nino years create peaks, and the definition uses a fixed historical threshold. | S07;S13 |
| E12 | Global mean sea-level rise rate | The satellite-era rate increased from 2.65 +/- 0.30 mm per year in 1993-2011 to 4.75 +/- 0.30 mm per year in 2012-2025. | A1 - Demonstrated temporal acceleration | Global | Regional relative sea level can rise faster or slower because of land motion, circulation, and gravity effects. | S03 |
| E13 | Surface-ocean acidification | Global mean surface-ocean pH declined at about 0.017 pH units per decade from 1985 to 2025, and 47 percent of sampled ocean area acidified faster than the global mean. | B - Strong worsening trend | Global sampled ocean | A persistent rate is not the same as a statistically proven acceleration of the rate. | S03 |
| E14 | Global coral bleaching footprint | The 2023-2025 fourth global bleaching event affected about 84.4 percent of the worlds reef area, compared with 68.2 percent during the 2014-2017 event. | B - Increasing scale and severity | Global reef area | Two global events do not define a smooth acceleration curve, but the larger footprint is a major escalation. | S14 |
| E15 | Global glacier mass-loss rate | Global glacier mass loss increased 36 +/- 10 percent, from 231 +/- 23 Gt per year in 2000-2011 to 314 +/- 23 Gt per year in 2012-2023. | A2 - Significantly higher recent glacier-loss rate | Global glaciers outside ice sheets | Regional glaciers respond differently and individual years are weather-sensitive. | S15;S39 |
| E16 | Combined Greenland and Antarctic ice-sheet loss | Combined ice-sheet loss increased from about 105 Gt per year in 1992-1996 to about 372 Gt per year in 2016-2020. | A2 - Significantly higher recent ice-sheet-loss rate | Greenland and Antarctica | Short-term annual changes vary with snowfall, melt, and ice dynamics. | S16 |
| E17 | Old, thick Arctic sea ice | Sea ice older than four years declined by about 95 percent, from an average 1.72 million km2 in 1985-2004 to about 0.095 million km2 at the September 2025 minimum. | B - Large-scale structural decline | Arctic | Minimum extent has not shown a statistically significant trend over roughly the last two decades even though the long-term 1979-2025 trend remains strongly negative. | S17;S18;S40 |
| E18 | Arctic June snow cover | June Arctic snow cover is now about half its 1960s extent, and melt onset is occurring earlier in many regions. | B - Strong worsening trend | Arctic land | Snowpack and melt vary widely by region and year. | S18 |
| E19 | Hydroclimate whiplash | Since the mid-20th century, global subseasonal wet-to-dry and dry-to-wet whiplash increased about 31-66 percent; interannual whiplash increased about 8-31 percent. | N - Observed worsening with nonlinear future response | Global | Ranges depend on definitions, datasets, and timescale. | S19 |
| E20 | Global drought severity and affected area | A 2025 Nature paper reported strong increases in global drought severity and affected area, but Nature added a May 14, 2026 Editor's Note stating that the paper's conclusions are subject to criticisms and corrections under editorial consideration. | D - Under active editorial review; not used as headline acceleration evidence | Global land | Because editorial review is unresolved, the reported global acceleration figures are retained only as qualified emerging evidence and are not used as Tier 1 proof. | S20 |
| E21 | Expansion of drylands | Drylands expanded by about 4.3 million km2, from 37.5 percent to 40.6 percent of global land excluding Antarctica, when 1991-2020 was compared with 1961-1990. | B - Strong worsening trend | Global land excluding Antarctica | Aridity reflects climate trends and land-atmosphere interactions, while desertification also includes land use and management. | S21 |
| E22 | Aquifer water-level decline | Among 542 aquifers with comparable multi-period records, about 30 percent showed accelerating decline, while 20 percent slowed, 16 percent reversed from decline to recovery, and 13 percent continued rising. | C - Regional or multi-driver acceleration | Global sample of monitored aquifers | Groundwater pumping is often the dominant direct driver; climate affects recharge and demand but is not the sole cause. | S22 |
| E23 | Global river-flood frequency or magnitude | No single uniform global acceleration is established across all rivers. Some regions and heavy-precipitation drivers worsen while others show weak, mixed, or management-dominated trends. | D - Mixed or not established globally | Global | Flood damage can rise rapidly because exposure and development increase even where the hydrologic hazard trend is unclear. | S38 |
| E24 | U.S. high-tide flooding frequency | National high-tide flooding is more than twice as frequent as in 2000, with increases over 400 percent in the Southeast Atlantic and over 1,100 percent at a Western Gulf example. NOAA says the national trend is accelerating. | A1 - Threshold-driven observed acceleration | United States coasts | This is regional evidence; local land subsidence and ocean variability modify relative sea level. | S23 |
| E25 | Total global tropical cyclone count | A robust increase in the total global number of tropical cyclones has not been established. | D - Mixed or not established | Global | Other properties, including rainfall, peak intensity, rapid intensification, and nearshore intensification, can worsen even without more storms. | S24 |
| E26 | Nearshore intensification rate | Mean nearshore tropical-cyclone intensification increased significantly over 1979-2020, amounting to about 3 knots per 24 hours across the period. | A2 - Significantly higher nearshore intensification rate | Global nearshore storm sample | This establishes a higher intensification rate over the period, not a single smooth second-derivative acceleration curve; it does not concern total storm counts. | S25 |
| E27 | Summer quasi-resonant planetary-wave events | The frequency of one class of quasi-resonant summer planetary-wave events tripled over the past half-century. | C - Emerging regional or mechanism-specific acceleration | Northern Hemisphere summer circulation | This does not prove that the entire jet stream is uniformly becoming wavier in every season. | S26 |
| E28 | Atlantic Meridional Overturning Circulation | The RAPID array indicates weakening of about 1.0 Sv per decade from 2004 to 2023. | D - Observed weakening; acceleration not established | Subpolar North Atlantic observing section | The direct record is short, natural variability is large, and this does not establish an imminent collapse. | S27 |
| E29 | Extreme energetic wildfire events | The frequency of the most extreme energetic wildfire events increased about 2.2-fold from 2003 to 2023; six of the seven most extreme years occurred in the final seven years. | B - Strong worsening trend | Global satellite-observed events | A published critique argues that the event metric partly reflects larger or more simultaneous fires rather than pure fireline intensity; total global burned area may decline. | S28;S29 |
| E30 | Wildfire-smoke mortality | The Lancet Countdown estimated about 154,000 deaths from wildfire-smoke PM2.5 exposure in 2024, reflecting a rising health burden in a hotter, more fire-prone climate. | B - Increasing consequence burden | Global modeled estimate | Annual smoke mortality is affected by ignition, land management, population exposure, and smoke transport as well as climate. | S33;S34 |
| E31 | Great Plains dust aerosol optical depth | Dust aerosol optical depth increased about 3-5 percent per year across much of the U.S. Great Plains from 2000 to 2018, approaching a doubling over the period in some areas. | C - Regional multi-driver acceleration | U.S. Great Plains | Rapid agricultural expansion was identified as the main driver; climate-linked drought and wind can amplify the hazard. | S30 |
| E32 | Severe and extreme dust-storm share in China | Total dust-storm frequency declined, but the proportion of severe and extreme events increased significantly since the early 2000s. | C - Regional severity increase | China | Fewer events can coexist with more intense events; the pattern is regionally heterogeneous. | S31 |
| E33 | Global dust burden | A simple monotonic global increase is not established. WMO reports major regional hot spots and rising human and economic burdens, while the 2024 global average was slightly below 2023. | D - Mixed globally; serious regional escalation | Global | Dust responds to drought, wind, land degradation, agriculture, grazing, and natural variability. | S32 |
| E34 | Permafrost temperature and tundra carbon balance | Cold permafrost at long-term Alaska sites warmed about 0.3-0.7 degrees C per decade over four decades; when wildfire emissions are included, the Arctic tundra region has shifted from a long-term CO2 sink to a source and remains a methane source. | C - Threshold-like regional state change | Arctic, with detailed Alaska monitoring | The carbon balance is spatially variable and sensitive to fire, vegetation growth, hydrology, and measurement coverage. | S36 |
| E35 | Heat-related mortality rate | Estimated global heat-related mortality averaged about 546,000 deaths annually in 2012-2021, 63.2% above the 335,000 annual average estimated for 1990-1999. A separate age-standardized mortality-rate metric is reported as 23% higher than in the 1990s. | B - Increasing consequence burden | Global modeled estimate | Demographics, adaptation, health care, urban form, and exposure affect mortality along with climate. | S33;S34 |
| E36 | Potential labor hours lost to heat | An estimated 640 billion potential labor hours were lost in 2024, 98 percent more than the 1990-1999 average. | B - Strong worsening trend | Global modeled estimate | Methods estimate potential work loss and do not equal measured payroll loss in every location. | S33;S34 |
| E37 | Dengue transmission potential | Climate-defined dengue transmission potential increased 48.5% for Aedes albopictus and 17.0% for Aedes aegypti from 1951-1960 to 2015-2024. | B - Strong worsening trend | Global climate-suitability indicator | Actual cases also depend on mosquito control, immunity, health systems, travel, housing, and reporting. | S33;S34 |
| E38 | People facing food insecurity linked to drought and heat | Drought and heat were associated with an additional 124 million people facing moderate or severe food insecurity in 2023. | C - Increasing consequence burden | Global modeled association | Conflict, prices, poverty, trade, and governance are major co-drivers. | S33 |
| E39 | Inflation-adjusted insured natural-catastrophe losses | Swiss Re estimates a long-run real growth trend of roughly 5-7 percent per year in insured catastrophe losses. | C - Compounding multi-driver consequence | Global insured losses | Exposure, property values, construction costs, insurance penetration, and hazard all contribute; the trend is not a pure climate signal. | S35 |
| E40 | Arctic surface temperature | Since 1980, annual Arctic temperature has risen nearly three times as fast as the global mean; 2016-2025 were the ten warmest Arctic years in the record. | B - Regional amplification and strong warming trend | Arctic | Arctic amplification means the Arctic is warming faster than the global mean; that comparison does not by itself demonstrate that the Arctic warming rate is accelerating through time. | S18 |
| E41 | Global and Arctic ocean deoxygenation | Observations show long-term global ocean oxygen loss. A 2024 historical-forcing model study estimated global oxygen-inventory loss increasing from 46.4 +/- 5.0 Tmol per decade in 1967-1994 to 116.8 +/- 6.6 Tmol per decade in 2002-2018; observation-based upper-ocean products showed an even stronger recent decline. Arctic observations found deoxygenation rates about six times the global mean in Atlantic-influenced waters. | B - Strong worsening with model-supported acceleration | Global model-observation comparison plus Arctic observations | Global oxygen observations are sparse, especially at depth. The acceleration bars are model-estimated rates; regional Arctic rates should not be generalized to the whole ocean. | S42;S43;S38 |
Appendix C. Figure and Data Notes
Fig. 1: Climate acceleration system cascade
Data type: Synthesis diagram. Sources: [S01, S02, S03, S07, S38].
Fig. 2: Distribution of evidence labels
Data type: Derived synthesis from the corrected 41-indicator evidence matrix. Sources: [Evidence matrix].
Fig. 3: Linear, accelerating, and exponential-like change
Data type: Schematic. Sources: Schematic or synthesis. Not observational data.
Fig. 4: Atmospheric carbon dioxide at Mauna Loa continues to climb
Data type: Observed data. Sources: [S41].
Fig. 5: Trailing ten-year carbon dioxide growth rate
Data type: Derived from observed data. Sources: [S04, S41]. Trailing ten-year rate computed from NOAA annual means; dashed reference levels are WMO decadal summaries.
Fig. 6: Global surface temperature anomaly
Data type: Observed data. Sources: [S06]. NASA GISTEMP anomalies use the 1951-1980 average as the zero baseline.
Fig. 7: Adjusted recent global warming rates
Data type: Reported statistical estimates. Sources: [S08]. Rates are from an analysis adjusting for ENSO, volcanic aerosols, and solar variability; method and interval matter.
Fig. 8: Earth energy imbalance acceleration estimates
Data type: Reported estimates. Sources: [S03, S07]. Different methods and time windows are shown side by side and should not be read as one continuous series.
Fig. 9: Reported global atmospheric water vapor trends
Data type: Reported estimates. Sources: [S09, S10]. Different datasets and windows; this figure shows consistent worsening, not a direct rate comparison.
Fig. 10: Upper-ocean heat accumulation rate
Data type: Reported estimates. Sources: [S03]. Bars use midpoints of reported multi-dataset ranges; error bars show half-range, not formal confidence intervals.
Fig. 11: Global mean marine heatwave days
Data type: Reported estimates. Sources: [S07, S13]. A fixed 1985-2014 threshold is used; El Nino contributes to individual peaks.
Fig. 12: Global mean sea-level rise rate
Data type: Reported estimates. Sources: [S03].
Fig. 13: High-tide flooding frequency increase
Data type: Reconstructed multiples from reported percent changes. Sources: [S23]. Regional values are not national averages and include local relative sea-level effects.
Fig. 14: Ocean deoxygenation rate in a historical-forcing model
Data type: Model-estimated global oxygen-inventory loss rates compared with observation-based products. Sources: [S42]. The model underestimates recent observed upper-ocean deoxygenation, so the bars must not be presented as a raw global observational series.
Fig. 15: Global coral bleaching footprint
Data type: Reported event footprint. Sources: [S14]. Two events show escalation in scale but do not form a continuous acceleration series.
Fig. 16: Global glacier mass-loss rate
Data type: Reported estimates. Sources: [S15, S39].
Fig. 17: Combined ice-sheet mass-loss rate
Data type: Reported estimates. Sources: [S16].
Fig. 18: Old Arctic sea ice area
Data type: Reported estimates. Sources: [S18, S40]. The periods differ: a historical multi-year average is compared with the 2025 seasonal minimum.
Fig. 19: Observed increase in hydroclimate whiplash
Data type: Reported range endpoints. Sources: [S19]. Ranges reflect alternate datasets and definitions.
Fig. 20: Expansion of global drylands
Data type: Reported estimates. Sources: [S21].
Fig. 21: Groundwater trend categories
Data type: Reported categories. Sources: [S22]. Groundwater is a multi-driver system strongly affected by pumping and management.
Fig. 22: Higher nearshore tropical-cyclone intensification rate
Data type: Reported estimates. Sources: [S25]. The graphic shows the reported net increase of about 3 knots per 24 hours across 1979-2020; it is a reconstruction of the reported trend, not raw annual observations and not proof of one smooth acceleration curve.
Fig. 23: Extreme wildfire event frequency index
Data type: Index reconstructed from reported fold change. Sources: [S28, S29]. The interpretation of the satellite event metric is debated; total global burned area can move differently.
Fig. 24: Illustrative Great Plains dust trend
Data type: Illustrative reconstruction. Sources: [S30]. Not raw annual observations. Agriculture was the main identified driver; drought and wind can amplify dust.
Fig. 25: Selected human consequence indicators with separate baselines
Data type: Reported estimates. Sources: [S33, S34]. Baselines and methods differ. Heat deaths are shown as the percent increase in estimated annual deaths (63.2%), labor hours as the 2024 increase over the 1990-1999 average (98%), and dengue separately for two mosquito vectors (48.5% and 17.0%).
AI Research and Verification Prompts
These prompts are designed to help readers test and update the evidence rather than outsource judgment. Require the AI system to provide primary-source links, distinguish observation from projection, and report contradictory findings.
- For [indicator], find peer-reviewed observational studies published since 2023 that test whether the rate of change has accelerated. Separate raw trends, adjusted trends, model projections, and event attribution. Give exact time windows, uncertainty, DOI links, and counterevidence.
- Audit the claim that [consequence] is increasing exponentially. Define the variable, fit linear and exponential alternatives only if data are available, test sensitivity to start and end years, and explain whether threshold exceedance could create nonlinear impacts without exponential physical forcing.
- Map [local region] to the global findings in this paper. Identify which indicators have local observational records, which global results cannot be transferred directly, and which local land-use, subsidence, pumping, poverty, or infrastructure factors modify the risk.
- Red-team the strongest climate-acceleration claim in this paper. List alternative explanations, data limitations, method sensitivity, contradictory studies, and the observations that would falsify the claim.
- Compare WMO, NOAA, NASA, IPCC, and at least two peer-reviewed papers on [indicator]. Explain why their estimates differ and whether the differences alter the practical conclusion.
- Create an updated evidence matrix for [indicator family] with columns for observed finding, acceleration type, spatial scope, time period, confidence, causal attribution, caveats, and original source link.
- Analyze how climate hazard, ecological degradation, resource overshoot, inequality, and governance interact for [consequence]. Avoid a single-cause explanation and identify both reinforcing and balancing feedbacks.
- Find examples where adaptation measurably slowed or reversed a climate consequence trend, such as groundwater decline, heat mortality, flood loss, or fire damage. State the conditions that made recovery possible and the limits to scaling it.
- Search for evidence that contradicts a uniform global increase in floods, cyclones, wildfire, dust, or circulation disruption. Explain how mixed global averages can coexist with dangerous regional acceleration.
- Update this white paper to the current date. Check every number against the newest version of the original source, mark changed values, and preserve an audit trail showing old value, new value, reason, and source.
Bibliography and Linked Sources
S01. Job One for Humanity (2026). Primary and Secondary Climate Change Consequences. Job One for Humanity. Original source
Use in this paper: Organizing framework for primary and secondary consequences; not used as the primary scientific authority.
S02. Job One for Humanity (2026). The Climageddon Feedback Loop. Job One for Humanity. Original source
Use in this paper: Organizing framework for linked climate subsystems; terminology is identified as Job One terminology.
S03. World Meteorological Organization (2026). State of the Global Climate 2025. World Meteorological Organization. Original source
Use in this paper: Primary synthesis for temperature, Earth energy imbalance, ocean heat, sea level, cryosphere, acidification, and extremes.
S04. World Meteorological Organization (2025). WMO Greenhouse Gas Bulletin No. 21. World Meteorological Organization. Original source
Use in this paper: Global greenhouse gas concentrations, annual changes, and radiative forcing.
S05. NOAA Global Monitoring Laboratory (2026 data release). Global Annual Mean Carbon Dioxide Data. National Oceanic and Atmospheric Administration. Original source
Use in this paper: Observed global annual mean atmospheric carbon dioxide through 2025.
S06. NASA Goddard Institute for Space Studies (2026 data release). GISTEMP v4 Global Land-Ocean Temperature Index. National Aeronautics and Space Administration. DOI: 10.1029/2018JD029522. Original source
Use in this paper: Observed annual global temperature anomaly series through 2025.
S07. Forster et al. (2026). Indicators of Global Climate Change 2025: annual update of key indicators of the state of the climate system and human influence. Earth System Science Data. DOI: 10.5194/essd-18-3889-2026. Original source
Use in this paper: Annual indicator update for human-induced warming, Earth energy imbalance, extremes, marine heatwaves, and climate forcing.
S08. Foster and Rahmstorf (2026). Global Warming Has Accelerated Significantly. Geophysical Research Letters. DOI: 10.1029/2025GL118804. Original source
Use in this paper: Statistical analysis of adjusted temperature records showing a recent acceleration signal, with important method sensitivity.
S09. Allan et al. (2022). Global Changes in Water Vapor 1979-2020. Journal of Geophysical Research: Atmospheres. DOI: 10.1029/2022JD036728. Original source
Use in this paper: Observed global atmospheric water vapor trends.
S10. Wan et al. (2024). Global total precipitable water trend during 1993-2021. Hydrology and Earth System Sciences. DOI: 10.5194/hess-28-2123-2024. Original source
Use in this paper: Independent estimate of atmospheric moisture increase.
S11. Martinez-Villalobos et al. (2025). Accelerating increase in the duration of heatwaves under global warming. Nature Geoscience. DOI: 10.1038/s41561-025-01737-w. Original source
Use in this paper: Observed and modeled nonlinear increase in long-duration heatwave risk as warming increases.
S12. Speizer et al. (2022). Concentrated and Intensifying Humid Heat Extremes in the IPCC AR6 Regions. Geophysical Research Letters. DOI: 10.1029/2021GL097261. Original source
Use in this paper: Regional observed trends in extreme wet-bulb temperature from 1979 to 2019.
S13. Marcos et al. (2025). Global warming drives a threefold increase in persistence and 1 degree C rise in intensity of marine heatwaves. Proceedings of the National Academy of Sciences. DOI: 10.1073/pnas.2413505122. Original source
Use in this paper: Observed increase in persistence and intensity of marine heatwaves.
S14. NOAA Coral Reef Watch (updated 2026). Current Global Bleaching: Status Update and Data. National Oceanic and Atmospheric Administration. Original source
Use in this paper: Observed spatial extent of the fourth global coral bleaching event.
S15. GlaMBIE Team (2025). Community estimate of global glacier mass changes from 2000 to 2023. Nature. DOI: 10.1038/s41586-024-08545-z. Original source
Use in this paper: Observed acceleration in global glacier mass loss.
S16. IMBIE Team (2023). Mass balance of the Greenland and Antarctic ice sheets from 1992 to 2020. Earth System Science Data. DOI: 10.5194/essd-15-1597-2023. Original source
Use in this paper: Observed acceleration in combined ice-sheet mass loss.
S17. National Snow and Ice Data Center (2025). 2025 Arctic sea ice minimum squeezes into the ten lowest minimums. National Snow and Ice Data Center. Original source
Use in this paper: Observed Arctic sea ice extent trend and recent minimum context.
S18. NOAA Arctic Report Card (2025). Arctic Report Card 2025. National Oceanic and Atmospheric Administration. Original source
Use in this paper: Arctic temperature, sea ice age, snow cover, ocean warming, and ecological indicators.
S19. Swain et al. (2025). Hydroclimate volatility on a warming Earth. Nature Reviews Earth & Environment. DOI: 10.1038/s43017-024-00624-z. Original source
Use in this paper: Observed and projected increases in hydroclimate whiplash.
S20. Gebrechorkos et al. (2025). Warming accelerates global drought severity. Nature. DOI: 10.1038/s41586-025-09047-2. Original source
Use in this paper: Qualified emerging drought evidence only. Nature added an Editor's Note on May 14, 2026 stating that conclusions are subject to criticisms and corrections under editorial consideration; this source is not used as Tier 1 acceleration evidence.
S21. United Nations Convention to Combat Desertification Science-Policy Interface (2024). The Global Threat of Drying Lands: Regional and Global Aridity Trends and Future Projections. United Nations Convention to Combat Desertification. Original source
Use in this paper: Observed expansion of drylands and widespread long-term drying.
S22. Jasechko et al. (2024). Rapid groundwater decline and some cases of recovery in aquifers globally. Nature. DOI: 10.1038/s41586-023-06879-8. Original source
Use in this paper: Observed accelerating groundwater decline in a substantial minority of assessed aquifers; multi-driver evidence.
S23. NOAA Office for Coastal Management (2026 access). High Tide Flooding: Fast Facts. National Oceanic and Atmospheric Administration. Original source
Use in this paper: Observed acceleration in U.S. high-tide flooding frequency and regional increases.
S24. NOAA Geophysical Fluid Dynamics Laboratory (updated review). Global Warming and Hurricanes. National Oceanic and Atmospheric Administration. Original source
Use in this paper: Assessment of tropical cyclone trends, including rapid intensification evidence and limits on total-count claims.
S25. Balaguru et al. (2024). A Global Increase in Nearshore Tropical Cyclone Intensification. Earth's Future. DOI: 10.1029/2023EF004230. Original source
Use in this paper: Observed increase in nearshore tropical cyclone intensification rate.
S26. Li et al. (2025). Increased frequency of planetary wave resonance events over the past half-century. Proceedings of the National Academy of Sciences. DOI: 10.1073/pnas.2504482122. Original source
Use in this paper: Observed increase in one specific summer planetary-wave-resonance phenomenon; not a blanket jet-stream claim.
S27. McCarthy et al. (2025). Observed decline of the Atlantic Meridional Overturning Circulation over the last two decades. Geophysical Research Letters. DOI: 10.1029/2025GL115055. Original source
Use in this paper: Observed weakening over a short direct-measurement period; insufficient to establish accelerating collapse.
S28. Cunningham et al. (2024). Increasing frequency and intensity of the most extreme wildfires on Earth. Nature Ecology & Evolution. DOI: 10.1038/s41559-024-02452-2. Original source
Use in this paper: Observed 2.2-fold rise in extreme energetic wildfire events from 2003 to 2023.
S29. Schutze and Resco de Dios (2025). Increases in the world's most extreme wildfire events probably driven by fire size and simultaneity. Nature Ecology & Evolution. DOI: 10.1038/s41559-025-02742-3. Original source
Use in this paper: Methodological critique arguing that some reported increase may reflect event size or simultaneity more than fireline intensity.
S30. Lambert et al. (2020). Dust Impacts of Rapid Agricultural Expansion on the Great Plains. Geophysical Research Letters. DOI: 10.1029/2020GL090347. Original source
Use in this paper: Observed regional 3-5 percent annual increase in dust aerosol optical depth, with agriculture as the main identified driver.
S31. Li et al. (2026). Frequency-Intensity Decoupling and Drivers of China's Dust Storms From 1961 to 2024. Journal of Geophysical Research: Atmospheres. DOI: 10.1029/2025JD045250. Original source
Use in this paper: Observed shift toward a higher proportion of severe and extreme dust storms despite lower total frequency.
S32. World Meteorological Organization (2025). WMO highlights hotspots, health hazards and economic cost of sand and dust storms. World Meteorological Organization. Original source
Use in this paper: Global dust context showing major regional hot spots but no simple monotonic global rise.
S33. Romanello et al. (2025). The 2025 report of the Lancet Countdown on health and climate change: climate change action offers a lifeline. The Lancet 406(10521):2804-2857. DOI: 10.1016/S0140-6736(25)01919-1. Original source
Use in this paper: Peer-reviewed primary source for heat mortality, labor capacity, wildfire-smoke mortality, dengue transmission potential, and food insecurity indicators. Metric definitions and baselines are kept separate.
S34. World Health Organization (2025). Climate inaction is claiming millions of lives every year, warns new Lancet Countdown report. World Health Organization. Original source
Use in this paper: Institutional summary of health indicators reported by the Lancet Countdown.
S35. Swiss Re Institute (2025). Natural catastrophes: insured losses on trend to USD 145 billion in 2025. Swiss Re Institute. Original source
Use in this paper: Long-run increase in inflation-adjusted insured catastrophe losses, driven by exposure, values, costs, and changing hazards.
S36. NOAA Arctic Report Card (2024). Arctic Terrestrial Carbon Cycling. National Oceanic and Atmospheric Administration. Original source
Use in this paper: Permafrost warming, tundra carbon-source shift when wildfire is included, and Arctic methane emissions.
S37. NOAA and American Meteorological Society (2025). State of the Climate in 2024. Bulletin of the American Meteorological Society. DOI: 10.1175/2025BAMSStateoftheClimate.1. Original source
Use in this paper: Independent annual climate synthesis and greenhouse gas context.
S38. IPCC (2023). Climate Change 2023: Synthesis Report. Intergovernmental Panel on Climate Change. DOI: 10.59327/IPCC/AR6-9789291691647. Original source
Use in this paper: Assessment baseline for established climate changes, impacts, and confidence language.
S39. Zemp et al. (2026). Global glacier mass change in 2025. Nature Reviews Earth & Environment 7. DOI: 10.1038/s43017-026-00777-z. Original source
Use in this paper: Peer-reviewed recent update reporting six of the seven highest glacier-loss years in the last seven years.
S40. NOAA Arctic Report Card (2025). Sea Ice 2025. National Oceanic and Atmospheric Administration. Original source
Use in this paper: Observed decline in old sea ice, earlier melt onset, and low extent.
S41. NOAA Global Monitoring Laboratory and Scripps Institution of Oceanography (2026 data release). Mauna Loa Annual Mean Carbon Dioxide Data. National Oceanic and Atmospheric Administration. Original source
Use in this paper: Long observed atmospheric carbon dioxide record used for the 1959-2025 concentration and growth-rate figures.
S42. Hollitzer et al. (2024). Competing effects of wind and buoyancy forcing on ocean oxygen trends in recent decades. Nature Communications 15:9264. DOI: 10.1038/s41467-024-53557-y. Original source
Use in this paper: Long-term global ocean deoxygenation, model-estimated acceleration in oxygen-inventory loss, and comparison with observation-based products. The paper explicitly notes model underestimation of recent observed deoxygenation.
S43. Wu et al. (2025). Amplified warming accelerates deoxygenation in the Arctic Ocean. Nature Climate Change 15:859-865. DOI: 10.1038/s41558-025-02376-0. Original source
Use in this paper: Observation-based Arctic deoxygenation rates roughly six times the global mean in Atlantic-influenced waters and attribution to amplified warming.
S44. Lenssen (2026). How robust is our accelerometer? RealClimate, guest commentary reviewing Foster & Rahmstorf (2026). Original source
Use in this paper: Independent scientific critique emphasizing that acceleration is not detectable as clearly in raw global temperature, and that mechanism and future persistence remain unresolved.
S45. Goessling, Rackow, and Jung (2025; online 2024). Recent global temperature surge intensified by record-low planetary albedo. Science 387(6729):68-73. DOI: 10.1126/science.adq7280. Original source
Use in this paper: Evidence that record-low planetary albedo and reduced low-cloud cover contributed to the exceptional 2023 warmth; the authors identify internal variability, aerosol reductions, and cloud feedback as unresolved contributors.
S46. Yoshioka et al. (2024). Warming effects of reduced sulfur emissions from shipping. Atmospheric Chemistry and Physics 24:13681-13692. DOI: 10.5194/acp-24-13681-2024. Original source
Use in this paper: Model estimate of about +0.13 W/m2 aerosol effective radiative forcing from the 2020 shipping sulfur reduction, with modest modeled global warming and larger regional effects.
S47. Watson-Parris et al. (2025). Surface temperature effects of recent reductions in shipping SO2 emissions are within internal variability. Atmospheric Chemistry and Physics 25:4443-4454. DOI: 10.5194/acp-25-4443-2025. Original source
Use in this paper: Large-ensemble counterevidence showing a small modeled global temperature response to IMO 2020 sulfur reductions that is not distinguishable from internal variability to date.
S48. Friedlingstein et al. (2026). Global Carbon Budget 2025. Earth System Science Data 18:3211-3288. DOI: 10.5194/essd-18-3211-2026. Original source
Use in this paper: Current fossil and total anthropogenic CO2 emissions trajectory; distinguishes near-flat total-emissions growth over the last decade from continued record fossil emissions.
S49. Ke et al. (2024). Low latency carbon budget analysis reveals a large decline of the land carbon sink in 2023. Preprint. Original source
Use in this paper: Near-real-time multi-method estimate of unusually weak 2023 land carbon uptake. Treated as evidence of an extreme sink-stress year, not proof of permanent sink collapse.
Do you like this page?
